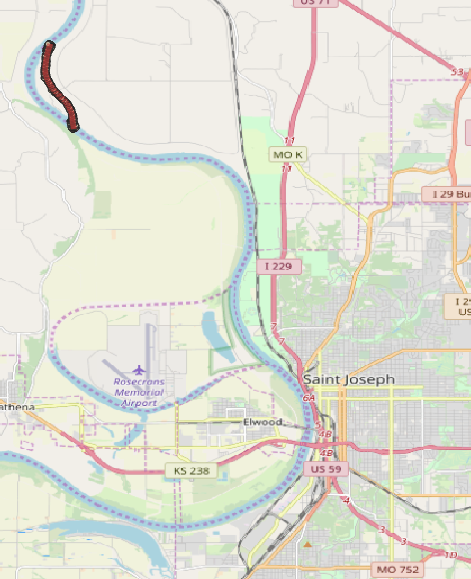
Scenario: You just won a contract to write a report on the geomorphic changes in Worthwhine Chute. You are going to automate many of the analyses for the report using the Cross Section Viewer.
Refer to the data import online help for additional information on how this process works.
Task 1 - Open the .csv file containing your data (WorthwhineChute_Data.xlsx).
The Cross Section Viewer can import survey data in several formats. Note that each cross section is designated in survey format (0+00, 1+00 etc.) with one cross section every hundred feet.
Task 2 - Create a new database for Worthwhine Chute.
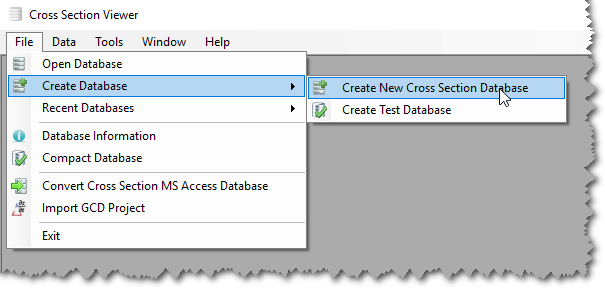
2.1 Open the Cross Section Viewer software. Select File -> Create New Cross Section Survey Database
Click the Windows key on your keyboard and then start typing the name of the software “cross section viewer”. The start menu should filter your installed software to just the Cross Section Viewer software. Click the icon or name to launch the Cross Section Viewer.
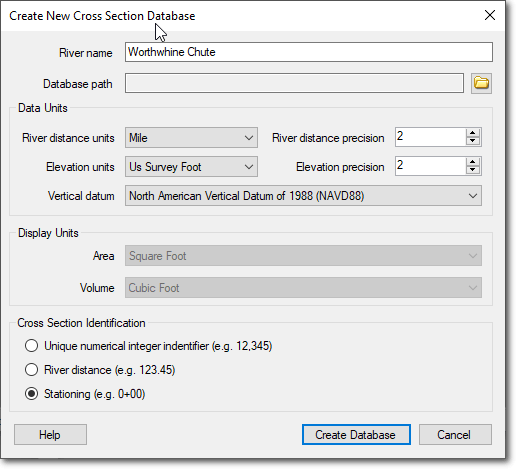
2.2 Name the river Worthwhine Chute, elevation units in US survey feet, vertical datum NAVD88.
You have the option of creating the database with cross sections identified as an integer, as a river mile, or in stationing format. Since our data is in stationing format, select that option.
Click “Create Database.” You do not necessarily have to match the database type to your survey data.
Task 3 - Create a blank survey template
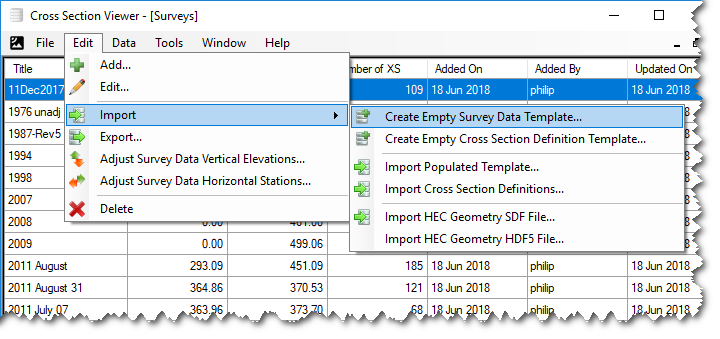
3.1 Select Data -> Surveys
3.2 Select Edit -> Import -> Create Empty Survey Data Template
3.3 Select a path for your survey template.
Call the template “Worthwhine 2013” or something similar. Select the “River stationing” option. Click “Create Database.”
Task 4 - Fill the survey template with the 2013 data
4.1 In Windows Explorer, browse to your “Worthwhine 2013” database template. Open in Access.
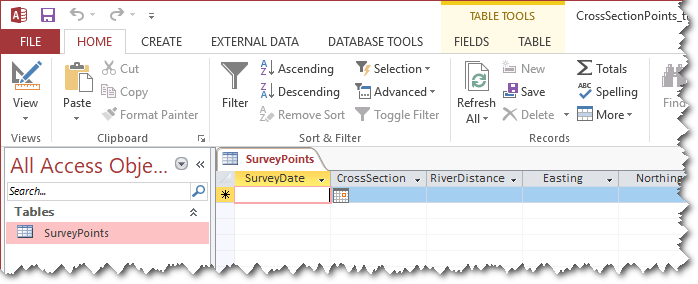
4.2 Double-click on the “survey points” table. A blank table will appear.
4.3 Open your .csv file.
Re-order (if necessary) to ensure that the correct columns are present and are in the same order as the table. Note: The column labeled “Offset” reports the perpendicular distance from the surveyed point to the target transect line. This field is computed using GIS and is a quality control metric when using boat-mounted single-beam sonar in moving water. If you don’t have this data (or don’t care about this data) you can fill the column with 0s.
Select the data (not the headers) and copy.
4.4 In Access, click on the light and dark triangle in the top right corner of the table. Control-V to paste in the data. Click Yes when Access asks if you want to paste in the data.
How many rows of data were pasted in?
Does this match the number of data points in the .csv file?
Note: Although the software allows you to specify a vertical datum, this is meta data only. There are no internal conversion processes to correct for different elevation datums. Surveys from different years should be converted to a consistent datum prior to import into your database.
Close Access and Excel.
Task 5 - Import the Filled Template
5.1 In the XS Viewer, in the “Surveys” window, select Edit -> Add
5.2 Name the survey “2013”
5.3 With the “2013” survey selected, chose Edit -> Import -> Import Populated Template
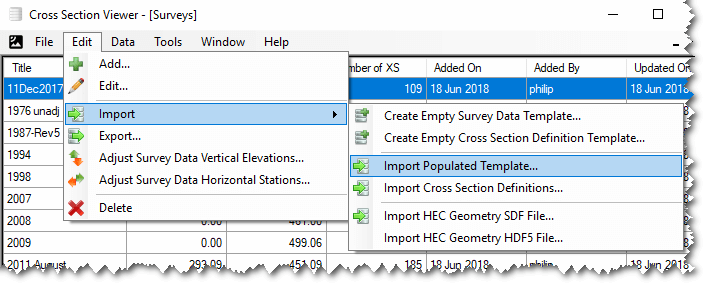
5.4 Browse to your populated template (e.g. Worthwhine 2013), choose “Existing survey” and 2013, and click OK.
5.5 A window pops up listing the new cross sections that are in the import file that are not in the survey in the database. Select “Add new cross sections” and click “Continue.”
How many XS are in the survey?
What is the min and max river mile?
5.6 Close the Surveys window.
TASK 6 - Create a selection
6.1 Choose Data -> Selections
6.2 Choose Edit -> New
6.3 Title the selection, “2013” and click the green “Plus” button.
6.4 Select “By Survey” for the attribute and select the 2013 survey. Click OK twice. Close the Selections window.
Task 7 - Import a water surface or other reference plane
7.1 Select Data -> Construction Reference Planes
7.2 Select Edit -> Import -> Create Empty Template. Name the data base “CRP2010.”
CRP is the “Construction Reference Plane” on the Missouri River. On another river, this could be “Bankfull” “2-year Flow” or any other water surface or sloping reference plane of interest.
Task 8 - Extra Problems
8.1 Plot cross sections 68+00, 70+00, and 72+00.
Click on the Edit menu and export the image for the chart and save to your computer.
8.2 Import the survey labeled 20XX. (See Tasks 3, 4, and 5).
8.3 Perform a volume change from 2013 to 20XX for river miles 0 to 1.
(Note that the longitudinal change tool expects a river mile, even though the cross sections are in 00+00 format.)
What is the total, cumulative volume change?