Construction reference planes (CRPs) represent artificial surfaces that can be used as an elevation datum. They provide an alternative to sea level against which to reference elevations. CRPs are represented by a series of vertical inflection points at specific river miles along the river.
Several of the analytical tools within the Cross Section Viewer software use CRPs as a uniform upper elevation for constraining cross section area calculations. For example, the first and last elevations of a single cross section may be different and require a uniform reference elevations for calculating a profile area. Moreover these two end point elevation might also be different between surveys. By extending cross sections up to an artificial, unchanging datum above the channel, a consistent upper extent can be established allowing for calculations to only differ by the channel bathymetry.
To view Construction Reference Planes (CRP), select Data from the main menu and then Construction Reference Planes.
The Edit menu allows you to add, edit and delete CRPs.
Add a New CRP
Open the CRP table by clicking Data and then Construction Reference Planes from the main Cross Section Viewer menu.
Click Add from the Edit menu.
Provide a unique Name for the CRP (it must be different from existing CRPs in the current database).
Optionally you can provide some remarks to describe the CRP.
Click OK to save the CRP.
With the new CRP in the database you can proceed to import inflection points into this CRP.
Edit a CRP
Open the CRP table by clicking Data and then Construction Reference Planes from the main Cross Section Viewer menu.
Select the desired CRP and either:
Double click the CRP
Right click and choose Edit
Choose Edit from the Edit menu.
The window that appears shows the inflection points for the selected CRP. You cannot change the inflection points on this screen, but you can edit the name and click Save and Close to commit your changes and this data can be edited in Microsoft Access.
The main feature of this CRP properties view is to show the elevations of all the inflection points by river mile. You can calculate the elevation of any desired river mile value using the river mile data entry box at the bottom of the screen. Click on the box and enter a numeric value then press tab to move off the data entry box. Alternatively you can use the up and down arrows to seek the desired river mile. As the river mile value changes, the elevation will be interpolated and show in the CRP elevation box as well as a red crosshairs on the main plot. This calculation uses simple interpolation between the two closest CRP inflection points to determine the desired elevation. Note that you can’t calculate a CRP elevation beyond the most upstream or downstream CRP inflection points.
/Online_Help/Data_Menu/data_management_mode.html
Data Management Mode
By default the lists that display the Selections and Long Profiles throughout the Cross Section Viewer software are filtered to only show those items that were created by the current user. In an organizational setting, where a Cross Section Viewer database is shared among several users, this means that Selections and Long Profiles are essentially private and inaccessible by other users.
Administrators can override this default behaviour and access the Selections and Long Profiles for all users by entering Data Management Mode. This option is available from the bottom of the Edit menu:
Clicking this menu item brings up a password data entry form where administrators should enter the password to unlock data management mode. The password can be obtained from the Cross Section Viewer development team.
Once the correct password has been entered the lists showing the Selections and Long Profiles will contain the entire contents of the database, and not just the current user. From here, the administrator can edit or delete any item, not just those that they created.
Notes
Data management mode only applies to the Selections and Long Profiles lists accessible via the Data menu. Users cannot use the selections and long profiles within Cross Section Viewer tools even when they are in data management mode. In other words, data management mode is provided to help teams using a central database to manage the contents that belongs to individual users. It is not intended as general purpose way to share selections or long profiles for use in the Cross Section Viewer tools.
Deleting items via data management mode is permanent and cannot be undone.
Other users will need to close and re-open the Cross Section Viewer to see any of the changes (edits or deletions) performed on their items by another user in data management mode.
/Online_Help/Data_Menu/horizontal_adjustment.html
Adjust Horizontal Stations
The horizontal adjustment tool helps users shift the underlying survey data for individual cross sections. This is sometimes useful if data have been imported into a database that posseses some kind of systematic offset. A good example is where cross sections - typically for older surveys - might have incorrect lateral alignment in the river, despite having high relative accuracy between stations. The horizontal adjustment tool can be used to shift these cross sections laterally into a more correct position, while maintaining the internal station distances of each surveyed point. See the video demonstration at the bottom of this page.
1. Backup Your Data
Warning! This process changes the underlying survey data stored in the Cross Section Viewer database. The changes are permanent and cannot be undone. It is strongly recommended that you back-up your database before using the horizontal adjustment tool.
2. Select a Survey
Open the Cross Section Viewer and choose Surveys from the Data menu.
Select the desired survey from the table that possesses the cross sections that you want to adjust. The horizontal adjustment tool only operates on a single survey at a time.
You will need to confirm your choice of survey and then, once again, click OK to proceed. These redundant steps are to safeguard your data and ensure that users only change data that they truly intend to adjust.
3. Horizontal Adjustments
Horizontal adjustments are performed on a single cross section at a time. Follow these steps to perform a single horizontal adjustment. Be sure to read the keyboard shortcuts section below to help speed up your workflow when adjusting multiple cross sections.
Select the upstream and downstream river mile range (#1) that contains the cross sections that you want to adjust. This doesn’t change any data. It merely filters the cross section lsit below to the appropriate river miles.
Select the cross section from the dropdown (#2) that you want to adjust. Note that CTRL + Up Down Arrow Keys also changes this selection.
Change the Current Adjustment value to adjust the cross section left or right. Decreasing the adjustment moves the cross section left while increasing it moves it right. Correspondingly, negative adjustments denote a shift left from the original cross section location. There are three ways to enter the adjustment value:
Type the value into the white area of the current adjustment.
Use the up/down arrows beside the current adjustment.
Use the left/right arrow keys on your keyboard.
Note that the size of the adjustment when using either the up/down adjustment arrows, or the up/down keyboard arrow keys, is controled by the increment value (#4). You can change the increment value by either:
Type the value into the white area of the increment.
Use the up/down arrows beside the increment.
Use the up/down arrow keys on your keyboard.
Click the Save button (#6) to permanently store the adjustment for the current cross section.
Click the Reset button (#6) to discard the current adjustment and restore the current cross section to its original location.
Click the History button (#6) to apply the last stored adjustment to the current cross section. Note that this doesn’t actually save the adjustment for the current cross section until the save button is actually clicked. This can be useful if an entire survey has approximately the same, systematic adjustment. Clicking the history button quickly gets a cross section in the approximately correct zone before allowing you to fine tune the adjustment.
Keyboard Shortcuts
The follow keyboard shortcuts are available to help speed up the workflow. The numbers in parentheses indicate the corresponding control in the illustration above. i.e. the keyboard shortuct performs the same operation as if the corresponding control were used.
Keyboard Up and Down arrow keys change the increment that each movement of the current adjustment (#4 in the illustration above).
Keyboard left and right arrow keys change the current adjustment (#5).
CTRL + Up and Down keyboard arrow keys changes the currently selected cross section (#2).
Enter key saves the current adjustment for the current cross section (#6).
Video Demonstration
/Online_Help/Data_Menu/import_hec.html
Import HEC Geometry SDF File
The Cross Section Viewer software is capable of importing cross section elevations and reference planes from the US Corps of Army Engineers (USACE) Hydrologic Engineering Center’s River analysis system (HEC-RAS) software.
Both .SDF and .HDF5 HEC geometry files are supported by the Cross Section Viewer:
Choose Surveys from the Data menu. The gridview of existing surveys will appear.
Choose either the SDF or HDF5 import item from under Edit > Import menu.
Browse to the desired HEC file and then the following form will appear that summarizes the contents of the file:
Select the units from the dropdown at the top of the form. This is especially important if the units of the HEC file do not match that of the cross section viewer database into which the data are being imported.
Check the box if you want the HEC bank stations to be imported as reference stations.
Check the box if you want the HEC water surfaces to be imported into the cross section viewer. Check the box beside each of the HEC water profiles that you want to import. The HEC profile name will be appended to the name specified in the Prefix textbox. This is set up this way so that repeat use of the same HEC profile names does not cause unique name conflicts in the Cross Section viewer, because each reference stage must have a unique name.
Check the box and specify a selection name if you want the import routine to automatically create a Selection for the cross sections contained in the HEC file. This is recommended because it makes it easy to quickly identify the data included in the HEC file within the various Cross Section Viewer tools.
Check the box if you want the cross section elevations to be imported into a new survey. Only in rare cases will you want to uncheck this box, but it does allow for importing water surface profiles without also bringing in the cross section data at the same time. If you check the box you must provide a unique survey name that does not already exist in the current database. You can optionally include a survey date and remarks.
Click Start to begin the import progress. A screen will appear showing the progress on the various processes involved. Should anything go wrong with the import, the cross section viewer database will be reverted to its original state.
/Online_Help/Data_Menu/import_hec_hdf5.html
Import HEC Geometry HDF5 File
/Online_Help/Data_Menu/importing_survey_data.html
Import Survey Data
Survey data can be imported into either a new or existing survey. The data must be in a comma separated value (CSV) plain text format that contains a single header row of column names ([] sample below)](#sample-csv-file). Different fields are required depending on method used to identify cross sections in the current database.
The CSV data must contain the station (distance along the cross section) as well as the vertical elevation of each survey point. These values must be in the same units as the datase into which the data are being imported. Moreover the elevation values must also use the same vertical datum as the database. Refer to the [database information(/Online_Help/File_Menu/#database-information) screen if you are unsure.
In the current version ofthe software, the columns in the text file must be separated by commas (not tabs etc). Strings should not be wrapped in quotes.
Note that when a database uses IDs to indentify cross sections, that the CSV file can only include cross sections that are already defined in the database. The CSV importer will fail if the CSV file contains cross section IDs that are not already defined in the current database.
Required Fields
The fields that are required in the CSV file depend on the way in which cross sections are defined in the current database:
This is the integer identifier that uniquely identifies each cross section. The integers in the CSV must already exist in the database or an error will be reported. This column is not needed if the database identifies cross sections by river distance or stationing.
River Distance
This is the river distance of the cross section for which the survey points apply. Unlike with CrossSectionID, if a cross section at the specified river distance is not already defined in the database then a new cross section is defined using the river distance value from the CSV file.
River Station
This is the text label that defines each cross section. Each label in the CSV file must already be associated with a cross section defined in the database or an error will be reported.
Station Index
This integer defines the sequence of survey points along a cross section. Each survey point must have a unique integer value, but they need not start with 1 for each cross section.
Station
This is the horizontal distance along the cross section for a particular cross section. The units must be the same as the elevation units defined in the cross section database. Refer to the database information screen if you are unsure.
Elevation
The elevation of each survey point. The units and vertical datum must be the same as those defined in the database.
Offset
This optional value can be used to store the Euclidean distance of the surveyed point from the theoretical line that represents the monumented cross section.
Easting
This optional value can be used to store either the geographic (unprojected) longitude or the cartesian (projected) map easting of the survey point.
Northing
This optional value can be used to store either the geographic (unprojected) longitude or the cartesian (projected) map northing of the survey point.
Survey Date
This optional value can be used to store the date on which a cross section was surveyed. Note that the only the survey date of the first record for each cross section is stored. Subsequent survey dates are ignored. In other words, each cross section is assumed to be surveyed in its entirity on a single date. Use the survey date format property to define the way in which dates are represented in the CSV file. All dates MUST confirm with this format or an error will be reported.
Vertical Uncertainty
This optional value can be used to define the vertical uncertainty with each survey point. The main cross section plot can represent this value as error bars when it is present.
Survey Point Code
Include miscellaneous text pertaining to each point using the survey point code column. This can be used for point quality information or other descriptors such as “edge of water” etc. Be sure not to include any commas in the text! Currently this survey point codes do not appear anywhere in the software, but they are included in the cross section export when data are exported from the database.
Sample CSV File
The following is a sample CSV file for three cross sections on the Missour River near Kansas City, US.
The Data Menu is the starting point for viewing the data contained within the open database. There are views for most of the different types of data stored in the database, as well as tools for importing and exporting the various types of data.
Note that whenever looking at a particular data view, the Edit menu will appear containing contextual tools for manipulating the specific data being viewed. i.e. when viewing the list of surveys, the Edit menu shows tools for adding, editing and deleting surveys within the database.
In This Section
Each distinct type of data stored in the Cross Section Viewer has a separate data management page:
Long profiles are intended to capture representative cross section elevations for use by other tools within the software. Each long profile consists of a set of inflection points down the channel. Each inflection point is identified by a river distance down the channel, a station (i.e. transverse position across the channel) and an absolute elevation.
Long profiles can capture a variety of properties along a cross section. Their most common use is to capture the deepest point of each cross section, referred to as the thalweg. Other properties such as the highest or average elevations are also possible.
The list of long profiles stored in the current cross section database is accessible via the Data menu of the main window.
The list showing the long profiles possesses an edit menu for creating new long profiles, editing the name and remarks of existing long profiles and also exporting data (see below).
Creating A New Long Profile
The following properties are required to create a new long profile:
Name - this is required and also must be unique across all long profiles in the current database.
Elevation Type - The long profile tool is capable of capturing the lowest, highest and average elevation along a cross section for use as an inflection point:
The lowest point, or Thalweg, is simply the lowest recorded elevation recorded for a particular survey at a cross section.
The highest point is the highest recorded elevation for a particular survey at a cross section.
The average elevation is determined by calculating the area of the cross section and dividing it by the top width. This provides an “integrated” cross section height that is then subtracted from the highest surveyed elevation to determine the average elevation. For this type of elevation, the cross section mid-point is stored as the long profile inflection point station.
The center of mass for is cross section is calculated by finding the centroid of each cross section. Note that each cross section is first capped so that both ends are at the same height. In other words, the lower end of each cross section is extended upwards vertically to the elevation of the other, higher, end point.
Survey - The single survey from which the cross section elevation data are used to generate the long profile. Note that inflection points will only be created for cross sections that are actually part of the selected survey. (i.e. if river distance 23.56 was not part of the 2014 survey, an inflection point at 23.56 will never be possible when using this survey for a long profile.)
Remarks - Optional remarks/description/comments.
Cross Section Filtering - All cross sections from the selected survey can be included, or just those that also exist in the specified selection.
Station Filtering - By default all points surveyed along each cross section are considered. However, it is possible to filter the points considered to just those between certain reference stations. Note, when using reference station filtering that only cross sections that possess two defined stations for the specified station type will be included. e.g. If filtering by the rectified channel line (RCL) then only cross sections that have two RCL stations defined will possess an inflection point in the output long profile.
Exporting Long Profile Data
The inflection points for each long profile can be exported to comma separated value (CSV) text file using the menu option under the Edit menu. The resultant file contains the following columns:
River distance - longitudinal position of the inflection point.
Sailing line distance - the high precision longitudinal position of the inflection point.
Station - the transverse/lateral position of the inflection point across the cross section.
Elevation - the absolute elevation of the inflection point.
The Cross Section Viewer includes four types of reference positions to assist with the various tools in the software. The first two are described here, while the latter two are described in other sections:
Both Reference stages and stations refer to fixed distances at a specific, monumented cross section. Stages refer to elevations and can be thought of as horizontal planes at a cross section location. Stations can be thought of as vertical lines.
Each stage and station belongs to a type. This container or parent type enables the user to group these reference distances into organizational concepts. For example, stages can refer to seasonal flows (e.g. “Mean August Flow”) and stations into width constraints (e.g. “navigational channel”). Within each of these types, the database can store a stage or station for each cross section location. Stages can only possess one entry per cross section, while stations can possess multiple entries. Typically, there are two entries for each cross section and the one with the lowest station value is considered the left bank item, while the one with the highest value is the right bank.
Reference Stage Types
To view Reference Stage Types, select Data from the main menu and then Reference Stage Types. You can add, edit and delete types using either by righting the desired item or using the Edit menu. See the section on importing and exporting data for instructions on how to bring in new elevations for a specific reference stage.
Reference Station Types
To view Reference Station Types, select Data from the main menu and then Reference Station Types. You can add, edit and delete types using either by righting the desired item or using the Edit menu. See the section on importing and exporting data for instructions on how to bring in new positions for a specific reference station type.
The cross section viewer maintains a list of river bend locations. These bends are only used in the map viewer and are not part of any analysis tool.
Each river bend is defined by a name and decimal latitude and longitude in degrees. To view and edit properties of an individual river bend, select Data then River Bends, then double click on river bend of interest.
To add a River Bend, select Edit then Add and enter desired properties.
To delete a River Bend, select Edit > Delete (or right click > Delete …)
To export the list of river bends in the database select Edit then Export (or right click > Export …)
/Online_Help/Data_Menu/selections.html
Selections
Selections represent a collection of cross section locations and are central to many of the tools within the Cross Section Viewer software. Users create selections to help isolate a set of cross sections on which they want to perform analysis. Some examples of selections are:
Cross section locations between river mile 10 and 20 that were collected in 2013.
Cross section locations that have a width less than 1000ft.
Cross section locations that were surveyed in both 2009 and 2013.
Users can create, edit and delete an unlimited number of selections. They can also merge two selections together to form a new one. The main list of selections is accessed by choosing Selections from the Data main menu item.
New Selection
To create a new selection click Selections from the Data menu on the main form. A grid showing the current selections in the database will appear. Next choose New... from the Edit menu.
Provide the following information:
Title: Enter the desired title (eg. 2013, River Miles 499+). The title cannot be blank and it must be unique; no two selections can have the same title.
Created by: Enter your name or some other information identifying who created the selection.
Description: Describe the Selection (eg. Generated cross sections of all river miles greater than 499 from 2013 Missouri River Survey)
Cross Section Filters: Define the Selection criteria by pressing the green ‘plus’ button. See next section.
Click OK to create and save the selection.
Cross Section Filters
Selections are created by identifying the cross sections that satisfy one or more filters. Each filter describes a single criteria for a single cross section attribute. The available attributes are:
Survey Width - the distance between the first and last surveyed point for a particular survey.
Average Point Spacing - the survey width divided by the number of points collected.
Maximum Point Spacing - the largest horizontal distance between any two points collected for a particular survey.
Minimum Elevation - the smallest vertical distance between any surveyed point and a user selected reference plane for a particular survey.
Maximum Elevation - the largest vertical distance between any surveyed point and a user selected reference plane for a particular survey.
Survey - the cross section must have been collected as part of the selected survey(s).
River Mile - longitudinal distance of the cross section along the channel. The river mile filter allows the user to further narrow the selection criteria by specifying how cross sections are picked based on their river mile:
All - all cross sections that meet the river mile distance criteria
Specified Interval
Exact Match only cross sections that occur at the specified offset from the value 1 distance criteria.
Closest Match - pick the closest cross section to each interval (this option is not implemented in the current software).
Each of these filters - with the exception of river miles - operates on a particular survey. In other words, when the software is attempting to determine if a particular cross section meets the cross section filter criteria, the value from a particular survey is used. On the contrary, river miles are simply based on the finite location of the cross section itself and is not influenced by any particular survey.
When choosing an attribute to use as a filter you must also choose one of the filter rules listed below. Note that Outside and Between do not “booked end” the criteria and so do not include values equal to the user input value 1 and value 2.
Less Than
Less Than or Equal To
Greater Than
Greater Than or Equal To
Outside
Between
Users can add, edit and delete filters using the relevant buttons. Multiple cross section filters are combined using AND logic. In other words for a cross section to be included in the selection it must meet ALL the listed filters. OR logic can be implemented by creating, then merging, separate selections.
Once the selection has been created the list of cross sections included in the selection are displayed on the right of the main selection gridview.
Merging Selections
Two existing selections can be merged to generate a new, third, selection. This can be useful if you want to build a complete selection in multiple parts and then combine the parts together once you have confirmed that each filter works the way you intended. It’s also a way to combine attribute filters using OR logic.
Merging selections does not alter the two input selections. The two source selections remain unchanged.
With the selections grid view visible, choose Merge... from the Edit menu on the main menu. Check the boxes beside the two existing selections that you want to merge. Provide a unique title and description for the new selection and then click OK. The resultant selection will be highlighted back in the main selection grid view and the cross sections that it contains listed on the right.
Deleting Selections
To delete Selections, highlight the Selection to be deleted, and then choose Delete from the Edit menu. You will be prompted to confirm that the delete should be performed. Deleting selections is permanent and cannot be undone. Note that deleting a selection does not delete the underlying survey data. It merely deletes the custom list of cross section locations.
Remove Cross Section from Selection
Cross sections can be removed from a selection. Highlight the selection in the main gridview and then highlight the cross sections to be removed in the list of cross sections on the right (use the SHIFT and CTRL keys to select continuous or discontinuous groups of cross sections respectively). The highlighted cross sections can be removed either from the main Edit menu or simply by pressing the Delete key. A message will appear to confirm that the deletion is intentional.
Exporting
An individual selection can be exported by first highlighting the desired selection in the main gridview and then choosing Export from the Edit menu. A list of the cross sections contained in the selection is exported to XML format. This is a text file in a special format that can be exchanged between collaborators and imported into another cross section viewer database (see next section).
Importing
Selections generated by the export feature (see previous section) can be imported into any cross section viewer database. Choose Import from the Edit menu and then select an existing XSX file previously generated by the software. A screen will appear showing properties for the selection stored in the XSX file: title, who created it, description, the date that it was created and the number of cross sections that it contains. Click OK to proceed and import the selection. Note that the title must be unique and not already exist in the current cross section viewer database.
/Online_Help/Data_Menu/survey_groups.html
Survey Groups
Survey groups collect together two or more surveys so that they can be used as if they are a single survey. This can be helpful if individual surveys capture different sections of a river. Grouping them together provides a single survey group that can be used within the Cross Section Viewer analytical tools while maintaining the data as separate surveys. Survey groups are optional and only necessary when you want to merge individual surveys together for the purpose of analysis. Survey Groups are maintained via the Data menu:
Each survey group possesses a unique name as well as a description. The list of survey groups shows the number of surveys within each survey group as well as information about its creation and the last time it was updated. See the video demonstration at the bottom of this page.
Adding a Survey Group
Click the Add button on the Edit menu.
Provide a unique Name that is distinct from all other survey groups.
Provide an optional description.
Add two or more surveys to the survey group by clicking the green plus button.
Click OK to save the survey group.
Survey Priority
Each survey group can only contain a single representation of each cross section. When two or more surveys within a survey group possess the same cross section then the survey with the highest priority take precedence. The precedence is represented in the software by the order of the surveys in the list. The survey at the top of the list has the highest priority. For example, in the screenshot above, should both the 2008 and 2011 August surveys both possess the same cross sections, then only those from the 2008 survey will be used, because the 2008 takes precedence over the 2011 August survey.
Editing Survey Groups
Use the Edit menu item or right click on a particular survey group to edit its properties. It is possible to add or remove surveys from a survey group and these changes are reflected immediately in the Cross Section Viewer analytical tools.
Deleting Survey Groups
Use the Delete menu item under the Edit menu or right click on a particular survey group to edit its properties. You will be prompted to confirm the deletion before the action takes effect. Deleting a survey group does not affect the underlying surveys or their data. That is, if you delete a survey group, the surveys that are a part of that group remain unaffected and their survey data persists in the database.
Using Survey Groups
Survey groups are available within the Cross Section Viewer software wherever surveys are shown. In the example below, a test survey group is listed below all the regular surveys in the regular cross section plot.
The two most fundamental types of data stored in the Cross Section Viewer database are surveys and cross sections. A cross section is a single transect of surveyed points across a river. The word cross section or transect are used interchangeably within the software. Essentially a cross section is a single line across a river, typically perpendicular to flow. Within the software, cross sections are considered permanent, monumented transects that are surveyed repeatedly. Each cross section is identified by a database ID and a river mile. The database ID can be user defined or assigned by the software. The river mile is always user defined and represents a positive distance upstream from a user defined position (typically but not necessarily river mile zero, where the river terminates at the confluence with another water body).
A survey is a collection of cross sections that were collected as a single initiative. This might represent one field season’s worth of data, or smaller campaigns perhaps strategically related to some kind of flow. The most common use of surveys is to think of them as a single visit to each monumented cross section. Repeat surveys would then represent repeat visits to each cross section. In practice, surveys don’t always include every cross section.
Most analytical tools within the software are based on either a single survey or comparing two surveys together, so it’s important for users to develop a consistent strategy for organizing their survey data.
Surveys
To view a list of surveys in the current database, select Data then Surveys. A list of surveys is displayed showing the river mile of the most downstream and upstream cross section surveyed as well as the total number of cross sections included in the survey.
To add survey, select Edit > Add and enter Name and Remark fields. Each survey must possess a unique name within the current database. Names can be anywhere between 1 and 255 characters long.
To edit survey properties, select (double-click, or right click and Edit) on the survey of interest. Edit the desired fields and then click Save. In addition to basic notes about the survey, you can store key-value pairs of metadata. Once you have added an item, you can double click the row in the metadata table to edit the metadata information on a pop-up form that is more convenient for entering longer text.
Importing data into a survey is covered in the Import section.
To export a list of surveys or delete survey data, see the Edt Menu Items help page.
For more information on Adjusting Survey Data Vertical Elevation, see its help page.
Cross Sections
It is important to understand the distinction between a cross section definition and a cross section survey. These two concepts crop up throughout the software and, for the sake of saving space in the software user interface, are not always labeled consistently.
A cross section definition represents a fixed location along a river, analgous to a monumented transect location. This location does not change over time. It is identified by a database ID and a river mile. Sometimes these definitions are monumented with concrete structures, signs or other markers. Often each definition possesses a pair of start and end coordinates used for navigation.
A cross section survey represents a single visit to a cross section definition and the collection of a set of survey points along the defined cross section.
Each survey can only include each cross section definition once.
To view the set of defined cross sections within the current database, select Data then Cross Sections. The table that appears contains one row for each defined cross section and a column for each survey in the database. A 1 is displayed where the particular cross section definition was captured during the survey.
You cannot add, edit or delete cross section definitions directly. Rather, cross section definitions are created while importing survey data.
Units
When users create a new database they must define the units that pertain to the data they intend to store in the database. These units are then assumed whenever the user imports data into the database. The values provided are simply copied into the Cross Section Viewer data directly, with no unit version.
The only time that the Cross Section Viewer converts values between units is when calculating areas and volumes. The software uses the popular UnitsNet library for this purpose.
It is possible to discover what units are used for a particular database simply by opening one of the plot tools. The units are also displayed in the database information screen.
River distances (down the channel), stations (across the channel) and elevations can be stored in any of the following units:
Centimeter
Decimeter
Foot
Inch
Kilometer
Meter
Mile
Millimeter
US Survey Foot
Yard
Area and Volume Units
Area and volume units are derived from the elevation units specified for each Cross Section Viewer database. Areas and volumes use the square and cubic equivalent of each unit. For example elevations stored in meters will have areas reported in meters squared and volumes in meters cubed. The one exception is that elevations stored in US survey feet have areas and volumes reported in standard square feet and cubic feet.
Note that the latest version of UnitsNet includes acre feet but that we have not upgraded to this version in the Cross Section Viewer software. We have an open issue to do so. Until then acre feet is not available in all tools.
Vertical Datums
Elevations are stored as 8-byte IEEE floating point numbers and refer to in one of two vertical datums:
The Cross Section Viewer does not perform any unit or datum conversion on elevation values. The values imported by the user are stored and then used directly in all displays and calculations. It is the user’s responsibility to ensure that all imported data use a consistent vertical datum.
/Online_Help/Data_Menu/vertical_adjustment.html
Adjust Vertical Elevations
The vertical adjustment feature shifts surveyed data up or down by a user specified offset. This can be useful if data errors or datum shifts need to be applied to an entire set of survey data. This operation is performed on a single survey and adjusts all cross section surveyed points collected as part of this survey. It does not, however, alter any other surveys contained in the same database.
The vertical adjustment is defined by a series of inflection points. Each inflection point has river mile and vertical shift. the shift is positive for an upward adjustment and negative for downward. The software determines the relative adjustment at each cross section location by interpolating between these inflection points for the desired river mile. In the simplest case, two inflections points should be provided, one at the most upstream cross section with the survey and one for the downstream. Alternatively, precise elevation adjustments can be specified for each cross section location.
Adjusting vertical elevations is permanent and cannot be undone! It is strongly recommended that you make a backup of your cross section viewer database before performing this operation.
To perform a vertical adjustment for a single survey:
Choose Surveys from the main Data menu.
Click Adjust Survey Data Vertical Elevations... from the Edit menu.
Select the survey that is to be adjusted.
Either enter the river miles and vertical adjustments by hand, or load them from a comma separated value (CSV) file. The CSV file should have two columns of data for river miles and elevations, separated by a comma; one cross section per row. A header row is required with the columns RiverMile and Elevation.
Clicking OK performs the vertical adjustment and shifts each surveyed point by the specified elevation, interpolating elevation shifts for cross sections that occur between the specified river miles.
/Online_Help/Data_Menu/whole_river_miles.html
Whole River Distances
The cross section viewer maintains a list of whole river mile locations on the Missouri River. These locations are only used in the map viewer and are not part of any cross section viewer analysis tool.
To view coordinates of whole river miles (i.e. 1, 2, 3 ….), select Data then Whole River distances. A grid appears showing the latitude and longitude (in decimal degrees) for each of the whole river miles on the Missouri River. These values are not editable within the Cross Section Viewer software and can only be adjusted by opening the underlying database using Microsoft Access.
Users can export the list of whole river mile locations by clicking the Export item within the Edit menu. A comma separated value (CSV) file is produced of all the values contained in the current database.
/Online_Help/File_Menu/compact_database.html
Compact Database
The Cross Section Viewer database file size will grow automatically to accommodate new data. However, the file size will not decrease if data are deleted. This is typical among popular database technologies and in most cases this does not present any operational issues.
Over time, or in the event that large portions of data are deleted (e.g. surveys with thousands of cross sections comprising millions of survey points), the underlying Cross Section Viewer database might become fragmented with the “gaps” where data have been removed. SQLite provides a convenient vacuum process for releasing unused space and compacting the database file to the optimum file size.
You can vacuum the current Cross Section Viewer database using the Compact Database menu option in the main File menu. This process can take several minutes for databases that are more than a few hundred megabytes.
Note: You should be the only user of the current Cross Section Database when you perform this operation. All other users and software should disconnect and avoid using the database in question until the vacuum operation has completed. SQLite does possess sophisticated locking and queuing procedures that will prevent file access conflicts, but it is best to have exclusive access to the database when performing this option.
/Online_Help/File_Menu/convert_database.html
Convert Database
The Convert Database feature upgrades legacy Microsoft Access Cross Section Viewer databases to the new SQLite format. Simply browse to the existing Access database and then specify a file location for the new SQLite copy.
This feature will copy the contents of an existing Microsoft Access database including all cross section definitions, surveys, selections, long profiles etc. Once you launch the conversion routine, a black command line window will appear while the process is running, showing progress messages. Note that this feature can take several minutes if the original database contains a considerable volume of data.
The conversion also produces a log file describing the steps performed. This file is stored adjacent to the original database and called conversion_YYYYMMDD_HHmmSS.log.
Prerequisites
The conversion routine requires that you have Microsoft Access (or at least the free Microsoft Access Runtime) installed on your computer. The conversion will use whichever version of Microsoft Access that you have on your computer and it will work with both the 32 bit (x86) or 64 bit (x64) versions.
Duplicate Cross Sections
The old version 1 of the Cross Section Viewer used a Microsoft Access database that allowed multiple occurances of a particular cross section within the same survey. In other words, an individual survey might collect the same cross section twice. This is necessary to support longitudinal calculations without ambiguity about which cross section occurance to use at a particular river distance.
Version 2 of the Cross Section Viewer precludes this and only allows a single occurance of each cross section within an individual survey.
Attempting to convert a legacy Access database that possesses this issue will produce the following message. The conversion will be aborted and no data will be imported into the new SQLite Cross Section Viewer database.
Identifying the Problematic Data
Browse to the folder where you attempted to generate the output SQLite database using the conversion tool.
Locate the log file, making sure that you open the latest file if you have attempted the conversion multiple times. Each file contains the date and time in the file name.
Review the log file and look for the lines that refer to the duplicate cross sections. They will look like:
2019-07-30T14:10:25.7454508-07:00,message,SurveyID 7 contains duplicate occurances of CrossSectionID 125.
Solution 1: Assign duplicates to new cross sections
Assign the duplicate cross section data to new monumented cross sections with very similar river distances. For example imagine that you have a cross section at river distance 1234.56 for which there are two sets of measurements within a single survey. The goal is to assign duplicate copies to a new river distance (e.g. 1234.57) leaving only one copy at the original river distance.
Open the original database in Microsoft Access.
Open the CrossSections table and find the record that matches the CrossSectionID specified in the log file. Note down the value in the RiverMile column.
Insert a new record into the CrossSections table and user a number for the RiverMile that is very close to the original value. (i.e. if original is 1234.56 then use 1234.57).
Note the CrossSectionID for the new record.
Open the CrossSectionSurveys table and filter the records to the relevant SurveyID and CrossSectionID from the log file.
Edit one of the records and assign it to the new CrossSectionID obtained from the preceeding step.
Repeat this process until all cross sections mentioned in the log file are assigned to new cross sections.
Solution 2: Assign duplicates to new surveys
Open the original database in Microsoft Access.
Open the Surveys table and add a new record with an appropriate title such as Duplicate Cross Section Data. Note the SurveyID assigned to this new record.
Open the CrossSectionSurveys table and filter the records to the relevant SurveyID and CrossSectionID from the log file.
Edit one of the records and assign it to the new SurveyID obtained from the preceeding step.
Repeat this process until all cross sections mentioned in the log file are assigned to new surveys. Remember that the new surveys must also compliy with the rule that they only contain each cross section only once.
Final Check
As a check that either of the two solutions worked, you can perform the following query that should return no records once all the duplicates are resolved:
Users can create new, empty databases into which they then import their cross section data. To create a new cross section database you must provide the information described below. Note that the selections made at the time of creating the database are permanent and cannot be changed once the database is created.
River name - The name of the river that the cross section data pertain to. This can be the name of a reach, chute, channel etc that describes, at high level, the data being stored. The river name is mandatory.
River Distance Units - the units of measurement used to measure the longitudinal separation up and downstream between cross sections.
Elevation units - the units of measurement used for the cross section stations and elevations. Both station and elevation measurements must use the same units.
River Distance Precision - the display precision for river distance measurements. The actual values are stored using 8-byte IEEE floating point number.
Elevation Precision - the display precision for station and elevation measurements. The actual values are stored using 8-byte IEEE floating point number.
Vertical datum - Choose the vertical datum used for the cross section elevations. The software currently allows for NAVD88 and NGVD29. All elevation data in a single cross section database must be on the same vertical datum.
Cross Section Identification - Select one of the options describing how cross section data will be identified in the new database. See below for an explanation.
Cross Section Identification
The cross section viewer maintains a master list of cross sections that represents the position along the river where transects are collected. All survey data is referenced to this master list. The software uses one of three ways to identify cross sections in this master list:
Unique Numerical Identifier - This is a unique ID for each cross section. The minimum allowable number is 1 and the maximum is 263-1. There are no constraints on the system of numbering, but typically numerbering starts downstream with the number 1, increasing in an upstream direction. When using IDs to identify cross sections, you must also specify the corresponding river distance (see next bullet).
River Distance - The river distance (in the units specified above) used to identify cross sections must be unique, positive values (i.e. one cross section at each river distance value). The river distance can be based on an arbitrary reference point (e.g. a confluence or structure) and does not have to refer to the outflow into the ocean or another river.
Stationing - River stations take the form of 0+00 where the first digit refers to hundreds of feet upstream of an arbitrary reference point. The second value is the number of feet upstream of the corresponding hundred foot station. For example a station of 1+2.3456 would refer to a cross section 102.3456 upstream of the reference point. When cross section stations are imported into the database they are converted to river distances in the background to support the calculation of control volumnes and longitudinal analyses.
Video Demonstration
/Online_Help/File_Menu/create_test_database.html
Creating Test Databases
The test generator is used to create a new cross section database with a series of simple, generic cross section data. These simplified cross sections are useful for understanding and validating the calculations underlying other tools within the cross section viewer software.
The cross sections generated by this tool are simple trapezoids, the dimensions of which are customizable by the user. All cross sections possess a wide horizontal top and a narrow horizontal bottom, with sloping sides. These cross sections are defined by four survey points. One high point on the left end, two lower points at the same bottom elevation and then a final point on the right end of the cross section at the same elevation as the first point.
Cross sections at intervals over a user-defined reach. The size of the cross sections at the top and bottom of the reach are specified by the user and then the software interpolates additional cross sections at a user-defined interval along the reach.
The tool is capable of generating multiple surveys, each with cross sections of different dimensions. As a final step, the generator also creates a selection in the output database that contains all cross sections in the database. Test cross section databases are currently only generated using feet and the NAVD88 vertical datum.
Steps To Generate Test Database
Launch the test data generator from the Tools menu in the Cross Section Viewer software.
In the test data generator form that appears enter the following:
River Dimensions
Downstream - The river mile of the most downstream cross section that will be generated in the test database. The downstream river mile must be less than the upstream river mile and valid values are from zero to 1,000.
Upstream - The river mile of the most upstream cross section that will be generated in the test database. The upstream river mile must be greater than the upstream river mile and valid values are from zero to 1,000.
CRP Elevation - This is the elevation (in feet) of a reference plane that will be generated in the test database. Nominally called a “construction reference plane” this can be any horizontal plane from which you want to calculate cross section profile areas. Typically, this plane is above the uppermost elevation of all cross sections, but that is not mandatory. The CRP elevation does not affect cross section profiles. Valid values are from 1 to 10,000ft.
XS Spacing - This is the longitudinal distance between cross sections. The test generator uses this spacing as the interval for laying out cross sections between the upstream and downstream river miles. The process of generating the cross sections starts at the downstream river mile and moves upstream. So if the distance between the downstream and upstream river miles is not evenly divisible by the spacing, the final cross section will not be precisely on the upstream river mile. Valid spacing values are from 0.1 to 100 miles.
RCL Stations
The rectified channel stations represent a pair of reference stations that are used for certain cross section measurements. The left and right stations are specified in ft from the left bank, and the same stations are used for all cross sections. Like the CRP, the RCL stations are independent of the cross sections and do not affect their size and shape. Valid RCL values are from 0 to 100 and the left station must be less than the right station.
Surveys
The user can specify multiple surveys for the test database. Each survey possesses data at each of the cross section river miles defined by the upstream, downstream and spacing inputs. Surveys control the shape of cross sections. So creating multiple surveys allows the user to vary the shape of cross sections in different ways for different surveys. This can be useful for exploring the calculations in the cross section viewer and how they vary with different cross section shapes. A minimum of one survey is required.
Survey Name - Each survey must have a unique name. It’s a good idea to incorporate the cross section dimensions into the survey name (“e.g. Survey with Top 100, Bottom 80, US Depth 10, DS Depth 20”).
Channel Dimensions
The channel dimensions control the shape of cross sections for individual surveys (see illustration at top of page). The top elevation, top width and bottom width are constant for all cross sections in the survey. The bottom elevation of each cross section is controlled via the depth inputs. Users can define constant cross sections down the channel by specifying the same upstream and downstream depths, or vary cross sections between two depths. The bottom elevation for each cross section is determined by interpolating its depth based on the longitudinal position of the cross section between the upstream and downstream river mile.
Top elevation - The constant, horizontal elevation of the start and end survey points on each cross section. Values are in feet and the valid range is from 0 to 10,000.
Top width - The constant horizontal distance between the start and end survey points on each cross section. The left station is always at station zero, and so this width essentially becomes the station of the right-most survey point. Values are in feet and the valid range is from 0 to 1000 and must be greater than the bottom width.
Bottom width - The width of the horizontal base of the cross section. This base is position equidistant from the left and right ends of the cross section, so that the profile of the cross section is symmetrical about the channel centerline. Values are in feet and the valid range is from 0 to 1,000 and must be less than the top width.
Upstream depth - This is the vertical distance between the first survey point and the lowest points on the cross section, for the most upstream cross section in the survey. Values are in feet and the valid range is from 1 to 1,000 and must be less than the top width.
Downstream depth - This is the vertical distance between the first survey point and the lowest points on the cross section, for the most downstream cross section in the survey. Values are in feet and the valid range is from 1 to 1,000 and must be less than the top width.
Output Test Database
The user must specify the file path for the output test database that is generated. The user has the option to close the current database and open a connection to the new test database that is generated.
/Online_Help/File_Menu/import_gcd_project.html
Import GCD Project
The import GCD project feature reads Geomorphic Change Detection (GCD) projects and generates a new cross section viewer database containing any GCD linear extractions.
The GCD is a separate, free software product that calculates the differences between digital elevation model (DEM) rasters. In the latest version of the GCD you can also extract elevations from DEMs or change detection results using polyline ShapeFiles and store them as linear extractions. These are comma separated value (CSV) text files stored within the GCD project folder structure.
The import process reads this folder structure and discovers all the linear extractions that have been performed, importing the elevations into a new cross section viewer database. The whole process is automated and there are no inputs or decisions required. It simply creates a new cross section viewer database each time that the import is run and stores it in a folder within the GCD project called Exports. The fact that a new database is created each time the tool is run is important because it allows you to continue to evolve your GCD project and continuously generate new snapshots of the project as separate cross section databases.
See the GCD help for generating linear extractions for more information on how to generate GCD results that work with this feature.
/Online_Help/File_Menu/
File Menu Items
The File Menu contains commands to open cross section databases, create new ones and close the software.
Open Database
The cross section viewer displays and manages cross section data stored in a single database. To use most of the functions in the viewer you need to first open a connection to a database containing the data that you want to work with.
Click the Open Database command and then browse to an existing cross section viewer database. If you do not yet have any databases, use the Create Database command to create a new, empty one. The cross section viewer software can only be connected to one database at a time. Opening a database closes the existing database connection.
Multiple users can use the cross section viewer software at the same time and connect to the same cross section database. Concurrent access allows users to view and make changes to a single database, even while other users are also making changes. See the relevant sections on Selections and the Data Menu for more specifics about how changes are shared between users.
Multi-user access can be useful for teams working with a single copy of a database stored on a network location that is accessible to the team members. Each user simply opens this single copy of the database as if it were on the local computer.
We do not recommend sharing the cross section database via cloud services such as One Drive, Google Drive or DropBox. It’s perfectly fine to keep the database in a cloud service and for a single user to access it there, but this should not be used as a way of simultaneously accessing a single copy of the database among several users.
Recent Databases
The Recent Databases menu item shows the file paths to the last five cross section databases used. Use this menu to quickly switch between different databases. Choosing one of the recently used file paths closes the current database connection (if one is open) and then opens the respective database.
Database Information
The database information menu item shows miscellaneous properties and summarizes the content of the currently opened cross section database. This menu item is only available when there is a currently open connection to a database.
This tool computes the distribution of depths and cumulative planimetric area with depths no deeper than a given depth increment. This tool operates on a reach of cross sections, whereas the related Reach Area and Depth Tool tool performs a similar calculation but for a single cross section.
This tool operates on a single survey and selection. The upstream and downstream extents of the analysis are constrained to the most upstream and downstream cross sections that are part of the selected survey and selection. If the user specifies an upstream and/or downstream river mile for the analysis that does not occur on a surveyed cross section, then the analysis interpolates the area for each depth bin based on the nearest two cross sections.
Inputs
Survey - A single survey that possesses the cross sections used in the analysis.
Selection - The selection that identifies a subset of the cross sections that will be selected for the analysis.
Water surface - the reference plane or long profile that represents the vertical upper limit of the analysis. This is depth zero at each cross section.
Depth increment - the vertical bin size used for the analysis. The units are the same as the survey data in the Cross Section Viewer database.
Upstream river mile - the most upstream point considered in the analysis (see comment above).
Downstream river mile - the most downstream point considered in the analysis (see comment above).
Plot Type - one of the following plot types:
Area Depth class (ac) - Absolute total bed area within each depth bin class. Values are in acre feet.
Area of depth class (%) - Relative bed area within each depth bin as a fraction of the total area of the channel. Values are in percent.
Cumulative area with depths less than (ac) - Absolute cumulative area from depth zero down to the depth of each bin”. Values are in acre feet.
Cumulative area within depths less than (%) - Relative cumulative area from depth zero down to the depth of each bin, as a fraction of the total area of the channel. Values are in percent.
Cumulative area with depths greater than (ac) - Absolute cumulative area of the channel that is deeper than the depth bin. Values are in acre feet.
Cumulative area with depths greater than (%) - Relative cumulative area of the channel that is deeper than the depth of the bin, as a fraction of the total area of the channel. Values are in percent.
The Compute button should be clicked to run the analysis each time that any of the inputs are changed. The exception is the Plot Type input. This can be changed on-the-fly without having to click the Compute button.
Export
Once the plot has been created, the underlying data, or the plot image itself, can be exported from the Plot menu. Plot data are exported to plain text, comma separated value (CSV) file, while plot images are exported to portable network graphic (PNG) files.
The Cross Section Viewer contains two tools to visualize areas and depths. The cross section area and depth tool works on a single location along the river, while the reach tool operates on a selection of cross sections, summarizing for the desired reach.
Planimetric Cross Section Areas
The analysis works on a single cross section at a time. Multiple cross sections for multiple surveys can be visualized at once, but the actual calculations are always performed for a single cross section. In other words, the results are for a single point in time and not a temporal analysis. The remainder of this explanation is therefore focused on a single cross section.
The analysis requires the user to select a reference plane elevation. This is the vertical upper limit of the analysis and represents depth zero (0). The analysis continues in increments of the user-defined depth bin size. In each depth bin, the profile area of the cross section is calculated between the upper and lower elevations of the bin. Parts of the cross section that extend above the upper depth bin boundary are not considered. And parts that extend below the lower boundary are also not considered. This process is repeated downwards from the reference plane until the upper depth bin elevation falls below the minimum elevation of the cross section. The profile area for each depth bin is accumulated for each bin and reported in the plot.
The areas for each bin are converted to volumes by multipling the profile area in each bin by half the distance to the next cross section in both the upstream and downstream directions. So in the diagram below, the area for a particular depth bin at cross section C is multiplied by half the distance to cross section D and half the distance to cross section F.
Using The Tool
Reference Plane - select a single reference plane that will become the upper elevation of the analysis. In other words, depth zero. Note that if you select multiple surveys, the same reference plane is used for all surveys. But if you select multiple cross sections, a separate reference plane elevation will be interpolated for each cross section river mile.
Depth Bin Size - the vertical bin height for the analysis. This is in the same units as the survey data in the Cross Section Viewer database.
Display Type - choose between area and volume (see above for explanation).
Incremental or Cumulative - controls whether to display the raw area/volume in each depth bin or accumulate the values, starting at the reference plane (depth 0) moving downward through the channel.
Selection - Pick the selection that possesses the cross sections for which you want to perform the analysis.
Cross Sections - This list displays just those cross sections that belong to the hightlighted selection above. Select a single cross sections, or hold down the SHIFT or CTRL keys to make either a contiguous or noncontiguous selection respectively.
Export
Once the plot has been created, the underlying data, or the plot image itself, can be exported from the Plot menu. Plot data are exported to plain text, comma separated value (CSV) file, while plot images are exported to portable network graphic (PNG) files.
Calculation Walkthrough
The test database generator was used to generate a hypothetical river with 10 idealized cross sections each separated by 1 mile. The river travels in a straight line with surface width of 100 ft that is reduced to 80 ft at the river bed. The angle of descent has been defined as 45º.
Length (L): in this example, the length between all cross sections has been defined as 1 mile, or 5280 ft. This value is constant. Therefore, the distance between the cross section of interest, and the nearest upstream cross section is 5280 ft. Similarly, the distance between the cross section of interest, and the nearest downstream cross section is 5280 ft. The distance between the two halfway points is therefore also 5280 ft. Thus, L = 5280.
Width (W): in this example, we will begin by considering the width of cross section of interest at depth (D) of 0 (i.e. the surface). At D=0, W has previously been defined as 100 ft. The geometry of the cross section can be separated into a rectangle, of M width and two right-angle triangles of S widths. Therefore, W at D=0 is 10 + 80 + 10 = 100 ft. The maximum depth has been defined as 10 ft. Therefore, W at D=10 is 80 ft (or M).
The width will change with depth. In this example, the trapezoid is symmetrical and the angle of descent has been defined at 45° (or pi/4 radians). The triangles can thus be represented as below where adjacent and opposite are equivalent to S and D respectively.
S (adjacent) changes with D (opposite) according to trigonometric principles:
S = (10-D) × tan(45º)
Within Cross Section Viewer, the depth at which the areas are calculated depends on the bin size. When the bin size is 2, the depth of the river is divided, in this example, into 5 discrete sections (0-2, 2-4, 4-6, 6-8, 8-10). The area is calculated at the halfway point between two depths – i.e. 1, 3, 5, 7, 9. Therefore, with a bin size of 2 using this idealized cross section, areas will be calculated at 1,3,5,7,9.
Sample planimetric cross section calculation at D = 3 (the second bin, when bin size = 2). First, calculate the value of S at D = 3
S = (10-D) × tan(45º)
S = (10-3) x 1
S = 7
Next, calculate the value of W given S = 7 (remember, M is constant)
W = 2 x S + M
W = 2 x 7 + 80
W = 94
Finally, calculate the area.
A = L x W
A = 5280 x 94
A = 496,320.00 ft^2
Therefore, planimetric area of cross section at depth of 3 ft = 496,320.00 ft2
To calculate volume, simply multiply the area by the height as defined by the bin size (note, not the depth). In this case, with a bin size of 2 feet, the height is 2. If the bin size were 3, the height would be 3 and so on.
V = L x W x H
V = A x W
**V = 496,320.00 x 2
V=992,640,000.00 ft^3
Therefore, the planimetric volume of cross section at depth of 3 ft = 992,640,000.00 ft3
The river miles, bend and cross section information is exported from the database to Keystone Markup Language (KML) format for display in the map viewer. You can also use these KML files in other GIS software such as Google Earth, ArcGIS and QGIS.
Features to export - Choose the type of features that you want to export. When generating a cross section KML file you can optionally include the names of the surveys in which each cross section was collected. Note that this is needed to support the popups in the map viewer, but that it does increase the size of the KML file generated.
Coordinate precision - You can control the number of decimal places used when the latitude and longitude for each feature are written to the KML file. Use -1 to write the maximum number of decimals places stored with the data in the database. Using fewer decimal places will create a smaller KML file but will degrade the accuracy of the GIS features generated.
Downstream and upstream river mile - When generating a river mile KML file you can filter the range of points using the upstream and downstream controls.
/Online_Help/Tools_Menu/Map_Menu/map_viewer.html
Map Viewer
The map viewer is an interactive map showing the location of the cross sections stored in the database along with several other pieces of useful reference information. This feature only applies to the original Missouri River Database.
Note that while the cross sections, bends and river miles shown in the map are stored in the database and managed through the cross section viewer software, the map does not currently reflect these changes. The map is based on a static snapshot of the data in the database and does not update automatically. Contact the developers to discuss how to update the information shown in the map.
Displaying Features
The map viewer currently displays an aerial satellite map together with layers for the Missouri River centerline, river bend names, river miles and surveyed cross sections.
The layers are scale dependent. When zoomed out more than a certain level only the centerline is shown. Zooming in closer makes the centerline and bends visible. And finally, when zoomed in enough the cross section layers become visible. Layer visibility can also be controlled manually by clicking on the corresponding legend box in the bottom right of the map.
Finding Features
There are several ways to find cross sections, bends and river miles in the map. The most basic is simply to click on the map and drag the cursor in the direction that you want to pan. Double clicking the map zooms in on the location clicked. The Plus/Minus control in the top left of the map also controls the zoom level.
River Miles - Click on the text box in the top left of the map and type a river mile (whole integers only) and then press enter. The map will pan to the corresponding location.
Cross Section ID - Click on the cross section box and type in the integer ID of a cross section on the Missouri River (between 1 and 11,813) and then press enter. The map will pan to the corresponding location.
Bends - You can either click on the bend dropdown list and scroll to the desired name, or you can click and then start typing the name of the bend that you want. The list will start filtering to those bend names that match the text that you have started to type.
Surveys - You can highlight the cross sections contained in particular surveys by clicking on the dropdown and picking the desired survey. The map turns grey any cross sections that were not collected as part of the desired survey.
Identifying Features
Click on any layer feature to open a popup showing information about a particular feature. Clicking on a cross section will open a popup that lists all of the surveys in which data were collected for that particular cross section.
Base Map
The base map used is sourced from Mapbox, Licensed under Mapbox Terms of Service. Includes commercial imagery acquired and processed by DigitalGlobe; Geodatastyrelsen, FOT Orthophoto, 2014; LGV Hamburg; National Land Survey of Finland, NLS Orthophotos, 2014; Geoportal Berlin, DOP orthophotos, 2014; and other imagery derived from public sources and processed by Mapbox.
Cross Section Viewer allows the user to compare how cross sections behave across surveys. This is a visual tool only, and does not perform any quantitative analysis or produce numerical results. The original intent of this feature was to illustrate the cross section filtering and truncation that is used in the longitudinal change and lateral change tools. See the cross section area calculations for more information on the methods used.
This tool simulates adjusting surveyed cross sections on a plot. The adjustments are merely visualizations. This tool does not write or store any information back to the cross section viewer database.
The compare cross section areas tool is launched from the main Tools menu.
New Survey - Select one of the existing surveys in the current database.
Old Survey - Select another of the existing surveys. Technically, the old survey doesn’t have to be chronically occur before the new survey. The terms new and old are merely designations for symbology on the plot.
Cross Section (XS) - Select the desired cross section. The cross section must occur in both the old and new surveys for the plot to work.
Station Filtering - the plot filtering manipulates how the new and old cross sections are trimmed horizontally.
Original Extents - simply plots the new and old cross sections as the data appear in the database.
Common Extents - trims each cross section laterally to the narrowest common extent. If the longer survey does not possess a surveyed point at the new, desired station then one is interpolated to ensure that both cross sections start and stop at the same station.
Reference Stations - Trims both surveys to the reference stations for the selected cross section. Note that the list of reference stations available in the dropdown is filtered to just those reference station types that possess two stations (i.e. a left and right station.) e.g. a rectified channel line reference station type will appear, but a sailing line reference station type will not (because it is defined by only one station).
Vertical Filtering - determines how the two cross sections are filtered vertically.
Max elevation - The default option simply extends both cross sections up to the maximum elevation of either surveyed cross section. That is, new survey points are added to the ends of the lower cross section such that the both cross sections start and stop at the same elevation (but at their individual, original station distances).
Reference Plane - Extends or truncates both cross sections to start and end at one of the reference plane stages. Note that the cross sections are capped at the reference plane elevation at anywhere along their length where they pass above the reference plane.
* Vertical Offset - The vertical filtering reference plane can be offset by a user-defined amount. A positive value represents an offset above the reference plane, while a negative value represents below the reference plane.
Plot Symbology
The goal of the plot is to show both the new and old cross sections, both before and after the filtering is applied. This essentially produces four cross section lines:
The original new survey cross section data are represented by a wide, pale green line.
The adjusted new survey cross section data - after the horizontal and vertical filtering are applied - are represented by a narrow, bold blue line.
The original old survey cross section data are represented by a wide, pale pink line.
The adjusted old survey cross section data - after the horizontal and vertical filtering are applied - are represented by a narrow, bold red line.
/Online_Help/Tools_Menu/elevation_change.html
Elevation Change Histogram
The elevation change histogram operates on two surveys that represent different points in time. The analysis looks at each cross section that occurs in both surveys and calculates the average elevation of stations in each survey. These average elevations are calculated by dividing the profile area of each cross section by its top width (not simply by dividing the distance between the first and last surveyed point by the net distance, which would lead to incorrect bias in the result when irregular point spacing occurs). The analysis then moves upstream from a user specified river mile distance and calculates the average elevation change at cross sections and accumulates these changes into user-defined bins.
Methodology
The illustration below represents two surveys X and Y collected on the same river channel at different points in time. In some cases the same cross sections were collected during both survey X and Y (C, D, E and G) while each survey also possesses cross sections that were not collected during the other survey; Survey X also collected at B and F, while survey Y collected data at A and F.
First, it should be noted that the elevation change analysis is only possible within the portion of the river channel where both surveys possess data. That is from cross section B to G. Outside of this range it’s not possible to calculate the elevation change in one or other of the surveys.
The process begins by identifying all the locations where both surveys are collected (B, C, D, E and G). The surveyed transects at these locations are trimmed to the common extent so that a comparison can be made. They are also capped at the maximum elevation of their survey. The average bed change is calculated by obtaining the averge bed elevation of each survey and then subtracting the old from the new survey.
The results are then binned by weighting the contribution of each transect within the river distance bins. The process starts at the specified downstream river distance and moves upstream in increments of the specified bin size. Within each bin each transect is assigned half the distance to the next contributing transect. So in the example below, assuming the user has requested the analysis be performed from river distance 4 to 14 in increments of 2, the following contributions would apply:
The final value for each bin is the weighted average of all bed elevation changes within the corresponding river distance bin.
Inputs
Upstream River Distance - The most upstream point at which the change is measured. If no cross section is present at this river distance in one or both of the surveys then elevation change is interpolated at this distance using adjacent cross sections.
Downstream River Distance - - The most downstream point at which the change is measured. If no cross section is present at this river distance in one or both of the surveys then elevation change is interpolated at this distance using adjacent cross sections.
Bin Size - the length of the bins used to report the analysis. The units are those specified as the “river distance units” when the database was created.
New Survey - the newer of the two surveys. Positive change is reported when the average bed measured in this survey is higher than that of the old survey.
Old Survey - the older of the two surveys. Negative change is reported when the average bed measured in this survey is higher than that of the new survey.
Reverse Y Axis - controls whether the the axis increases from left to right or is displayed in the reverse direction. This control is simply controls the display and does not affect the values displayed.
You can export cross section elevation data in several plain-text formats. This tool operates on a single cross section selection and for one or more surveys.
Click on export cross sections from the tools menu in the cross section viewer. First ensure that a selection exists containing just the cross sections in question. Remember that you can copy, merge and edit existing selections to achieve the desired set of cross sections. Then switch to the Surveys tab and select one or more surveys that you want to include in the export. Hold down the CTRL key while clicking to select multiple surveys.
When multiple surveys are exported, their data appears sequentially in the output text file.
Cross Sections - Single click on the one selection in the list that contains the cross sections that you want to export. The selection in question will be highlighted in blue.
Export Format - Choose between one of three plain-text export formats:
Comma Separated Value (CSV) Format
The following cross section fields are written to the file, separated by commas:
SurveyName - The name of the survey to which the survey data belong.
CrossSectionID - The internal numerical identifier of the cross section. If your database identifies cross sections by river mile or station then this ID will not be user defined, and instead it merely represents an arbitrary, internal ID used by the software to identify each cross section.
RiverMile - the longitudinal river mile of the cross section along the channel.
SailingLineDistance - the centerline distance of the cross section along the channel. This will be identical to the river mile if separate centerline distances have not been provided*.
Easting - The UTM easting coordinate of each survey point for the selected survey.
Northing - The UTM northing coordinate of each survey point for the selected survey.
Elevation - The elevation of each survey point for the selected survey.
Date - the date that the survey point was collected*.
Station - the distance of the survey point from the left bank.
Offset - the Euclidean distance of the point that was actually surveyed from the position on the monumented cross section that it represents*.
Survey Point Code - survey point metadata that was included with the survey during data import.
*Certain fields are not populated in all cross section databases and will appear in export files as null values. That is, all cross sections are exported for one survey, then a new line is inserted, and then the cross section data for the next survey is written.
This tool provides geomorphic summary information on the relationship between the shape of cross-section change relative to depth or distance from a defined location. For example, this tool can quantity statements such as “the deeper areas filled in” or “the channel degraded by lowering the sand bars rather than the thalweg.” Other uses include defining floodplain deposition level with respect to channel banks or levee breach locations.
Export
The current plot can be exported to either an image file or the underlying data as a comma separated value (CSV) text file.
When using a CSV file, the output file includes the following fields:
Cross Section ID - The cross section viewer database unique identifier of each cross section.
River Mile - The cross section river mile.
Station - The midpoint of the station bin for which the rest of the values refer. i.e If you selected a 5ft bin size, then the first station value will be the station of the leftmost cross section station plus 2.5 (see station filtering above).
New Elevation Depth Below Ref - The average depth of the bed in the new survey below the reference plane.
Depth Below Old Elevation - The average depth of the bed in the old survey below the reference plane.
Bed Change Between Surveys - The difference between the average depth of the bed in the two surveys.
Defined Station - The station distance of the defined station for this cross section.
Distance From Defined Station - The distance between the middle of the bin and the defined station for this cross section. Negative values indicate that the bin midpoint is left of the defined station.
Distance From Defined Station Relative To River - The distance between the middle of the bin and the defined station adjusted for the position of the defined station. Positive values occur between the defined station and the farthest bank from the defined station. Negative values occur between the defined station and the nearest bank to the defined station.
Left Channel Margin - The station of the left bank channel margin.
Right Channel Margin - The station of the right bank channel margin.
Channel Width - The distance between the right and left channel margin banks.
Closest Bank - L indicates that the defined station is closest to the channel margin left bank. R indicates the right bank.
Defined Station To Closest Bank - The distance between the defined station and the closest bank.
/Online_Help/Tools_Menu/long_profile_viewer.html
Long Profile Viewer
Long profiles can be displayed and exported from the long profile viewer. This tool displays datasets produced by the long profile generator. You need to have already generated one or more long profiles before you can use the viewer.
Features
Check the box beside one or more long profiles to include them in the plot(s). Use the long profile generator tool to produce additional datasets.
Check the box beside one or more reference planes to include them in the plot(s). Use the Construction Reference Plane tool to generate additional reference planes.
Enter the upstream and downstream river mile that you want to display.
Select either the Stations and/or Elevations plot types to display. Elevations can either be displayed as absolute values above sea level, or as an offset from a selected reference plane.
Choose whether you want the y axis (left side) of the plot to represent upstream. This is merely a convenience feature for those used to visualizing their data with river distances increasing to the left or right.
Exporting Data
Choose Export Plot Data under the Plot menu to produce a CSV file of the data currently being displayed in the plots. Note that the upstream and downstream extent of data that is written to the file is controlled by the river distance controls on the form. i.e. the export will only contain data for river distances between the displayed upstream and downstream values. However, zooming the plot (see video) does not affect the data export. If the upstream and downstream controls are set to river distances 300 to 400, but you have zoomed to 350 to 375, the export will still contain data for distances 300 to 400.
You can also export a graphic of the currently displayed plot by clicking on Export Image from the Plot menu.
Video Demonstration
/Online_Help/Tools_Menu/longitudinal_change.html
Longitudinal Change
The Cross Section Viewer can calculate the Longitudinal Change (either Volume or Bed Elevation) between two surveys for a range of River Miles.
Methodology
The cumulative volume change for a given river mile represents all the volume change between two surveys summed from the upstream cross section to the given river mile. This is accomplished by computing the volume change over all control volumes, which are regions of the river bounded by two cross sections. Volume change over a control volume is computed as the average of the cross sectional area changes at the two bounding cross sections multiplied by the distance along the sailing line between the cross sections. The sum of all upstream control volume changes constitutes the longitudinal volume change at that location. Thus, the cumulative volume change is zero at the location of the most upstream cross section and equivalent to the volume change in the first control volume at the second cross section.
User Inputs
Select / input the desired parameters below:
Cross Sections: Select the desired Selection. The selection contains the Cross Sections available from the Selection filters.
Surveys: Select the New Survey from the drop down menu to contrast against the Old Survey from the drop down menu.
Station Filtering: Select the Original Cross Section Extents, Common Cross Section Extends, or Use Reference Stations from the drop down menu. Next, select Inside or Outside radio buttons.
Vertical Filtering: Select Max Cross Section Elevation at River Mile or Reference Plane.
Plot: Select desired Upstream and Downstream River Mile values.
Update Plot: When all desired inputs are selected, click the Update Plot button
/Online_Help/Tools_Menu/navigation_channel.html
Navigation Channel
The navigation channel tool calculates the widest and deepest channels that satisfy user defined criteria. The tool operates on cross sections within a single survey. The ends of each cross section are extended vertically up to a reference plane, from which all depths are measured. Qualifying channels are then defined as rectangles extending vertically down from the reference plane to the specified depth and horizontally along the cross section to at least the specified width.
The tool identifies all continuous portions of each cross section that are deeper than the specified minimum depth and at least as wide as the minimum width. From this list of “qualifying channels”, the tool reports both the widest qualifying channel as well as the deepest qualifying channel that has the specified minimim width.
Any sections of the cross section that are shallower than the minimum depth are ignored entirely. Note that, depending on the minimum depth and width specified, that there may not be a solution for all cross sections (see the section on Generating Selections below for identifying which cross sections do or do not possess a solution).
Inputs
The navigation channel tool is available under the Tools menu, once a Cross Section Viewer database is open.
Selection - a subset of cross sections on which the tool will operate. Cross sections that were collected in the selected survey, but are not part of the selection will be ignored.
Reference Surface - the horizontal plane from which depths are reported.
Station Filtering - The tool can operate on survey points along the entire length of each cross section, or it can be constrainted to just those points between or outside of reference station pairs.
Click the calculate button to perform the navigation channel analysis. Then select an individual cross section to visualize the results. The widest qualifying channel is displayed in green and the deepest channel in blue. The minimum depth is shown in bold.
Export Results
You can export the results for all cross sections to a comma separated value (CSV) file. Each row in the CSV file represents an individual cross section where a soluton was obtained. Cross sections where there was no solution are omitted from the file. The CSV contains the following columns:
River Distance - the distance down the channel of the cross section.
Minimum Depth - the user specified minimum depth.
Minimum Width - the user specified minimum width.
Widest channel Width - the width of the widest qualifying segment, calculated as the right minus left station.
Deepest Segment Left Station - the left of river station where the deepest qualifying segment starts.
Deepest Segment Right Station - the right of river station where the deepest qualifying segment ends.
Deepest Segment Average Bed - the average depth of the bed in the deepest qualifying segument.
Deepest Segment Min Depth - the minimum depth of the deepest segment of specified width.
Deepest Segment Max Depth - the maximum depth of the deepest segment.
Use the Plot menu to export the results of the analysis or to save the current cross section chart to an image file.
Generating Selections
Use the Plot menu to create new selections from either the list of cross sections for which a solution to the current analysis was found or not found. Provide a unique name for the selection as well as an optional description.
/Online_Help/Tools_Menu/options.html
Options
Clicking on the Tools menu and Options opens the window that controls several high level, configuration settings for the Cross Section Viewer software. Options are stored in the current user profile. They are not shared between users or computers. i.e. if you use the Cross Section Viewer software on multiple computers you will need to set the options on each computer separately.
General
Select whether or not the most recently loaded database loads on startup automatically. If the last used database cannot be found then the software will launch with no database open.
The Plot Cross Sections tool is the main way to visualize cross section data. Cross sections are displayed in profile view, across the river, perpendicular to flow. Multiple cross sections can be viewed simultaneously and several different types of reference lines can be included in the display.
The window is divided into three panes: The left pane contains the controls to select which cross sections are included in the view. The bottom pane contains summary metrics for each cross section currently being displayed. And the right pane contains the cross section plots themselves.
Cross Section Controls
Start by selecting one or more surveys for which you want to display. You can select multiple surveys by clicking the first desired item in the list and then holding down shift to click a second item. All surveys between the two items clicked will be selected. A discontinuous set of surveys can be selected by holding down the control key (CTRL) key while you click.
Pick the selection that contains the cross Selection that you want to view in the plot. If you need to create a new selection, you need to close the cross section plot tool before you can use the new selection.
Pick one or more cross sections from the bottom list using the same shift or control key technique described above. Cross section profiles will start to appear in the right pane once you have at least one survey and cross section selected.
Note that this bottom cross section list only contains the cross sections that occur within the currently selected survey(s) and selection above. If you are looking for a particular cross section and it doesn’t appear it is probably that it wasn’t surveyed in the currently selected survey(s) and/or doesn’t exist in the selection. visit the surveys and Selection tool to investigate whether this is true.
Cross Section Metrics
The bottom pane shows summary metrics for the cross sections that are currently displayed in the main plot area.
Survey - name of the survey to which the cross section belongs.
River distance - longitudinal position of the cross section along the river. River distance zero is downstream.
Point count - total number of surveyed points along the cross section. i.e. the count of black dots in the figure above.
Straight length (D) - planimetric, 2D euclidean distance between the first and last surveyed point.
Bed Length (A + B + C) - sum of the lengths between each survey point along the cross section.
Min Elevation (F) - the absolute, vertical elevation of the lowest surveyed point.
Max Elevation (G) - the absolute, vertical elevation of the highest surveyed point.
Average Elevation (G - ((H/D)/2)) - the average elevation of all surveyed points.
CRP Elevation (I) - the absolute, vertical elevation of the newest CRP for this cross section.
Min Offset - the smallest offset of any survey point along the cross section.
Max Offset - the largest offset of any survey point along the cross section.
Average Offset - the average of all offsets for surveyed points along the cross section.
Offsets
Survey vessels commonly attempt to follow monumented cross sections (using GPS and/or navigation software), but the actual path that the vessel follows differs from the intended, monumented cross section. In these situations, an offset can be recorded that captures the planimetric, 2D, Euclidean distance of the point that was actually surveyed from the position on the monumented cross section that it represents.
The Plot Options tab (see below) enables the user to filter out survey points that possess an offset greater than a specified tolerance. This can be useful if several surveyed points possess excessive offsets.
Note that this main cross section plot tool is the only tool in the cross section viewer software that uses offsets and performs this filtering. All other tools use all surveyed points for each cross section whenever performing any kind of analysis.
Plot Export
The currently displayed plot image as well as the underlying data can be exported at any time. When exporting the data, the stations and elevations for all currently displayed cross sections are written to a comma separate plain text ASCII file. Th plot image can be exported as Bitmap, GIF, JPEG, PNG, TIFF or WMF format.
Plot Options
The plot options tab contains several ways of controlling the cross section plot.
Y Axis - You can adjust the minimum and maximum values of the vertical axis on the main plot. Values are in the same units as the cross section elevation data.
Offset filter - If the cross section data possess offset values, this control can be used to exclude survey points that possess an offset greater than the value shown (see graphic and explanation above).
Line width - controls the thickness of the line used to draw all cross section profiles. Units are in screen display pixels.
Reference stations - adds vertical lines to the plot at the relevant distances along the cross sections. Reference stations are managed using the main Data menu.
Reference stages - adds horizontal lines to the plot at the relevant elevations. The items available are a combination of the construction reference planes and Reference Stages stored in the current database. Both types can be managed using the main Data menu.
LiDAR Integration
The plot can combine one set of cross section data that pertain to inside the river channel with another dataset that represents the out-of-channel surface. This is useful when you have boat-based bathymetric surveys in addition to LiDAR data for the surrounding floodplain. Typically the bathymetric data will extend almost to the edge of the wetted channel (or as shallow as the boat could navigate) whereas the nearinfrared LiDAR is absorbed by water and will not extend much beyond the dry surface. Providing these two datasets are available for the same monumented cross sections, the software is capable of integrating the two surveys into a single plot line. Note that the underlying data are not altered. They are merely combined for display purposes.
The following image shows two surveys for the same cross section. The red line represents a single bathymetric cross section captured by boat. It extends to either bank as far as the boat was able to navigate. The blue line represents elevations extracted from a LiDAR digital elevation model (DEM). Notice the flat line in the middle of the cross section where there is no LiDAR response because water absorbs near infrared radiation.
Turning on the LiDAR integration feature merges these two lines into a single cross section line that uses the bathymetry in the channel and the LiDAR data on the land. Note that while you can store as many LiDAR surveys as needed in a cross section viewer database, only one can be used at a time for display purposes.
Editing Survey Information
You can edit the information associated with an individual cross section within a survey. Right click on the cross section in the table at the bottom of the main plot window, or choose the “edit cross section survey” item from the Plot menu.
You can enter a description or choose whether or not to provide a survey date. You can also enter key-value metadata items. Once you have entered a key value entry, you can double click it to get a pop-up form that is more convenient for entering long text.
/Online_Help/Tools_Menu/surface_difference.html
Surface Difference Plot
The surface difference plot helps visualize the changes in an individual cross section between two points in time. Parts of the cross section where the elevation has increased over time are shaded in blue, while places where the elevation has lowered are shaded in red.
Note! This feature currently only works for surveys that possess elevations at matching stations. This is true for GCD linear extractions but not necessarily with other survey data where the stations at which elevations are collected might differ between surveys. We intend to enhance this feature to handle such cases and also to report statistics summarizing the differences.
Inputs
New Survey - The more recent survey that will be displayed as a light grey line.
Old Survey - the older survey that will be displayed as a solid black line.
Selection - the selection containing the cross sections that you want to visualize.
Cross Section - the individual cross section within the selection that you want to visualize. Note that only one cross section can be visualized at a time.
/Online_Help/help_menu.html
Help Menu
The Help Menu contains several items for getting help with the cross section viewer software and also updating the software itself.
Cross Section Viewer Online Help
Launches the online help for the software (this site) in the user’s default web browser.
Check For Updates
The Cross Section Viewer is capable of detecting when software updates are available and automatically downloading and updating the software. See the Downloads page for more information. This operation only updates the software itself and does not change any cross section viewer databases that you may have created.
About the Cross Section Viewer
The About screen shows the current version of the cross section viewer software as well as showing the contact information for getting help with the software.
/Online_Help/window_menu.html
Window Menu
The window menu provides several ways to quickly organize the currently open screens within the cross section viewer software.
Use the horizontal or verical organization to arrange windows such that you can see multiple tools at the same time. The cascade option is useful when you want to keep windows open but minimized, so that they do not clutter the screen. This option organizes the remaining non-minimized windows into a series of cascading windows for easier viewing.
This method simply uses the area of each cross section, with each cross section bounded by its own highest elevation. This method is useful when the channel has migrated laterally and you want to consider the full width of the channel in both the new and old surveys.
Common Cross Section Extents
This method constrains both cross sections to just the stations that are surveyed in both the new and old survey. Cross sections are capped at their highest elevation.
Reference Plane
This method uses the full extent of both cross sections, but extends them vertically up to a reference plane. This upper elevation can optionally be lowered with a user-specified offset. Areas above the offset reference plane are excluded.
Inside Reference Stations
This method constrains both surveys laterally to their common extent and within a left and right reference station. Cross sections are capped at their highest elevation.
Outside Reference Stations
This method only considers area of both cross sections that is outside of the reference stations, but common to both cross sections. Cross sections are capped at their highest elevation.
The profile area of a cross section is performed throughout the Cross Section Viewer software by calculating the area of the polygon described by the surveyed points. This shape is always considered two-dimensional and does not account for any offset or longitudinal variation in the survey points. It simply uses station and elevation.
D = Straight Length
A + B + C = Bed Length
E = Construction Reference Profile
F = Minimumm Elevation
G = Maximum Elevation
I = Construction Reference Plane
G - ((H/D)2) = Average Elevation
H = Cross Section Area
The offset respresents the Euclidean distance of the point that was actually surveyed from the position on the monumented cross section that it represents. It can be illustrated as below:
Typically the surveyed ends of a cross section do not occur at the same elevation and so the software always levels the top of the cross section by either:
Adding a temporary survey point at one or both ends of the survey the same elevation as the highest point along the cross section.
Capping the cross section at the height of a reference stage, such as the CRP or some user-defined, vertical offset from this reference stage.
North Arrow Research developed a separate, dedicated piece of software to perform the extraction of elevations from LiDAR generated digital elevation models (DEMs). The goal of the tool is to move along cross section lines at a specified interval and extract the elevation value from a DEM raster. The tool is written in such a way that multiple cross sections can be specified in a single ShapeFile, and multiple rasters can be specified in separate GeoTIFF or IMG raster files.
Software Availability
This Elevation Extractor software is available upon request from North Arrow Research by contacting info@northarrowresearch.com.
Prerequisites
The elevation extractor software requires the following software to be installed before it can be used:
Windows XP or newer.
Microsoft .Net Framework 4 Client Profile.
ArcGIS Desktop 10.1 (cannot be any other version of ArcGIS).
10Mb free disk space for the software, plus enough space to store large output data files.
Inputs
Double click the ElevationExtractor.exe file to launch the software.
Click the Browse button to navigate to a ShapeFile that contains the cross section polylines. Each polyline should be a separate, single part feature. The ShapeFile must possess an integer column attribute called XSID that contains the same cross section IDs used in the Cross Section Viewer database where you ultimately want to use the elevation data. If you don’t intend to use the extracted elevations in the Cross Section Viewer then you need to create this field and populate it with arbitrary integers anyway.
Transect Filtering - Select whether you want to process all transects or just a subset specified by an upstream or downstream ID.
Extension - The extension is an optional distance beyond either end of each cross section polyline that will be sampled. Typically the extension is used to take cross section lines that terminate at the channel margin and elongate them by the specified extension out onto the floodplain.
Interval - The distance between sample points along the extended cross section lines where elevations will be extracted from the DEM rasters. The interval is applied from the start/from point of the line geometry for each line.
Line Digitization - This affects whether the lines in the ShapeFile are digitized from left to right bank or reversed. This is useful if the lines were digitized backward. It can be hard to tell which direction was used and it might be necessary to view the lines in ArcMap using an arrowhead symbology to determine the direction used.
DEM Rasters - Use the Add and Remove buttons to incorporate more or less raster files into the process. At least one raster must be specified. Note that the rasters must use the same map projection as the cross section ShapeFile. And if you specify transects within a specific ID range, the cross sections should obviously overlap the particular rasters specified in the tool.
Outputs
You can choose whether to output the extracted elevations as a ShapeFile, comma separated value (CSV) flat text file or both. The former is useful for visualising the extracted locations and elevations as verification for how the tool works. The latter is the most effective source for importing the elevations into the Cross Section Viewer Software.
Importing Elevations Into the Cross Section Viewer Database
The following instructions describe the workflow for getting the extracted elevations from CSV output files and into a copy of the Cross Section Viewer database. The database must already have all the cross sections defined using the same cross section IDs that were present in the cross section ShapeFile used during the elevation extraction process described above.
Backup the relevant Cross Section Viewer database. This process will alter the data in the database!
Open the Cross Section Viewer database in Microsoft Access.
Switch to the External Data ribbon toolbar.
Click the Text File button to start the process of importing the CSVs.
Browse to the CSV file in question.
The first time that you run the tool you should choose the create new table option and call the new table ExtractedElevations. Subsequent executions of this process should append the contents of the CSV file to the same ExtractedElevations, thereby accumulating all the LiDAR elevations into a simple temporary table.
Click Next.
Choose the Comma dilimeter. The columns identified in the CSV file should be displayed.
Click Next again until the data import process is complete.
Open the ExtractedElevations table and review the data. It can be useful to sort, count and filter the data using the built-in Microsoft Access features to ensure that all the desired records are present.
Next create a new Survey record. This can be done manually in Access by adding a row to the Surveys table. Or using the Cross Section Viewer software Create Survey tool. Regardless you need to open the Surveys database table and determine the value of the SurveyID field for the survey into which you want to import the LiDAR elevations.
Create a new Microsoft Access SQL query. Switch to SQL view and copy and paste the following SQL query text into the Window:
PARAMETERS [@SurveyID] Short;
INSERT INTO CrossSectionSurveys ( CrossSectionID, SurveyID )
SELECT ExtractedElevations.CrossSectionID, [@SurveyID] AS Expr1
FROM ExtractedElevations
GROUP BY ExtractedElevations.CrossSectionID, [@SurveyID];
Run the query and when prompted enter the SurveyID integer value identified in the previous step. The confirmation message should state the number of cross sections contained in the ExtractedElevations table.
Create a second, new Microsoft Access SQL query. Switch to SQL view and copy and paste the following SQL query text into the Window:
PARAMETERS [@SurveyID] Short;
INSERT INTO CrossSectionSurveyPoints ( Station, Elevation, Easting, Northing )
SELECT ExtractedElevations.Station, ExtractedElevations.Elevation, ExtractedElevations.Easting, ExtractedElevations.Northing
FROM ExtractedElevations INNER JOIN CrossSectionSurveys ON ExtractedElevations.CrossSectionID = CrossSectionSurveys.CrossSectionID
WHERE (((CrossSectionSurveys.SurveyID)=[@SurveyID]));
Run the query and again, enter the SurveyID integer from before. The confirmation message should state the total number of elevation points across all cross sections. Ensure that this value is the same as the total number of records in the ExtractedElevations table.
Open the Cross Section Viewer software and use the Plot Cross Sections feature to review the final elevations. Take extra care to ensure that the left and right banks are oriented correctly in the new LiDAR cross sections, repeating the entire process if they are backward.
Notice how the LiDAR cross section data possess a flat surface in the wet part of the river channel. This is because the near infrared wavelength of conventional LiDAR is absorbed by water, producing no response for wet areas of the landscape. Also note that the LiDAR cross section data extend by the specified distance beyond the existing, bathymetric surveys that were constrained to the channel (except where the extended transect passed off the edge of the LiDAR DEM data extent).
Results
In March of 2016, the Elevation Extractor tool was run on LiDAR data for the Missouri River and the results imported into the USACE Cross Section Viewer database.
The extraction was performed on 1m LiDAR DEM with a 2000ft extension and sampling distance of 4ft. The process was performed in three batches that corresponded to the way the data were provided by USACE:
3_Platte_to_Kansas
4_Kansas_to_Osage
5_Osage_to_Mouth
Each of these batch runs included several DEM rasters. The results of each batch were output to a CSV file and these three files combined into a single copy of the Cross Section Viewer Missouri River database, provided to USACE.
A sample of the extracted elevation are shown below. The plot shows:
A single bathymetric survey (yellow) that only extends to the wetted extent of the channel.
The LiDAR data that extends 2000ft onto the floodplain, or until the edge of the LiDAR DEM data extent.
The images on the right show the LiDAR DEM with the original transect in blue. In several cases you can observe shallow sections or hard structures that are clearly identifiable in the extracted LiDAR elevations.
Technology
The Elevation Extraction tool was written in C# using Visual Studio 2010 Professional. The software uses ArcObjects 10.1 Service Pack 1. The binaries and source code are available from North Arrow Research upon request.
This page describes the GIS workflow to extract the distances along the Missouri River sailing line for each of the USACE surveyed cross sections. These distances along the sailing line will be incorporated into the cross section viewer and used instead of river mile distances for all longitudinal calculations.
Overview
The ArcGIS Location Features Along Routes geoprocessing tool was used to identify the distance along the sailing line where each cross section intersects the sailing line. The inputs provided by USACE were:
Cross sections ShapeFile containing a separate polyline feature for each surveyed cross section on the Missouri River. The attribute Field xsection_id contains the database IDs of each cross section.
River network sailing line ShapeFile containing a separate polyline feature for the major channels in the Missouri river drainage.
The tools used were:
ArcGIS 10.1 Service Pack 1.
Microsoft Excel.
Workflow
1) The river network ShapeFile was added to ArcMap. The feature representing the mainstem of the Missouri river was selected and then the “Export Data” feature of ArcMap used to export just the selected feature into its own ShapeFile. This one feature represented the entire Missouri river while the analysis only required the lower XXX miles. So the output ShapeFile was edited and the mainstem split at approximately river mile XXX. The upstream section was deleted, leaving a line representing just the lower section of the Missouri River.
2) The lower Missouri River ShapeFile was intersected with the Cross Sections ShapeFile to produce a point ShapeFile containing the locations where the cross sections meet the sailing line.
3) The Create Routes geoprocessing tool was used to prepare the lower Missouri River ShapeFile for the analysis. This tool indexes the geometry in the ShapeFile and makes it eligible for further linear referencing tasks. The inputs to the tool were as follows:
4) The Locate Features Along Routes geoprocessing tool was used to extract the distances of the cross section intersect points from the sailing line. Note that the inputs to this tool included the sailing line route (not the original sailing line ShapeFile, but the output of step 3). Also note that a search tolerance of 2ft was used to ensure that all the intersect points achieved a match with the sailing line. Using a value of zero meant that some points were omitted from the output because they didn’t reside on the sailing line precisely (despite being produced by an intersect analysis earlier in the workflow.)
5) The output of step 3 was a DBF table that can be opened in Microsoft Excel. The table contains both the cross section IDs (via the intersect points) and the distance along the sailing line. Upon review, the distances were discovered to originate from the upstream end of the lower Missouri River polyline and so each value was subtracted from the total distance of the line (obtained from the attribute table to be 2641302.39 ft) to obtain the sailing line distance from the downstream end.
6) As a validation check, 10 cross sections within the first and last mile of the lower Missouri River where selected and their distances along the sailing checked by hand using the ArcGIS measure tool. All values were verified to be correct. (Note that each vertex of the sailing line must be clicked on for the measure tool to provide identical results. The results will only match approximately if the measure tool is used from cross section point to cross section point.)
The final results of this analysis are attached at the bottom of this page.
/Technical_Reference/database_schema.html
Database Schema
The Cross Section Viewer software uses a local SQLite database to store all survey data and definitions. The figure below shows the individual tables and relationships within the database. A brief overview of each table is provided below.
PK - primary key
FK - foreign key
UK - unique key
The term Audit Fields refers to four fields used to track who last changed a particular record and when:
AddedOn - UTC time stamp of when the record was added.
AddedBy - Windows user name of the person that added the record.
UpdatedOn - UTC time stamp of when the record was last updated.
UpdatedBy - Windows user name of the last person to edit the record.
Tables
Surveys - A survey represents a collection of cross section measurements, typically collected during a single field campaign.
SurveyGroups - Multiple surveys can be grouped into a survey group which then acts like a survey in the cross section viewer survey. This is useful if individual surveys capture separate regions of a river system but should be combined together for use in the tools within the cross section viewer.
SurveyGroupValues - Lists the individual surveys that are part of each survey group.
CrossSectionSurveys - A survey cross section is a single measurement of a cross section performed during a survey at a particular cross section. In other words, cross sections capture the unchanging definition of a cross section location (river mile etc.), while survey cross sections capture everything measured at a cross section during a particular survey.
CrossSectionPoints - A cross section point is an actual measurement at a particular cross section station. There are many cross section points in a single cross section survey.
CrossSections - A cross section refers to a particular river distance where repeated surveys measure the bathymetry of the channel. Each measurement of a cross section is referred to as a “cross section survey”.
StageValues - Stage types capture reference water stages or important elevations at a cross section. These can be things such as mean August flow or bankfull flow etc. Each cross section can have multiple reference stages. Each reference stage is of a particular type. Note that reference stages are tied to cross sections (as opposed to survey cross sections) and as such do not change with each survey. i.e. they are for reference only. Also, note that CRPs are stored in their own tables (described below).
StageTypes - Stage types represent special types of water stage, such as mean August flow. When recording a reference stage for a particular cross section it must be associated with a stage type. Stage types are used in the StageValues table. Users can edit or add items to this table.
StationValues - Reference stations refer to special stations along a cross section that have a particular meaning. For example the sailing line and rectified channel line are reference stations. Each reference station is related to a particular station type. Note that reference stations are tied to cross sections (as opposed to survey cross sections) and as such do not change with each survey. i.e. they are for reference only.
StationTypes - Station types represent special cross section stations such as a sailing line or rectified channel line. Station types are used in the ReferenceStations table. Users can edit or add items to this table.
Selections - Selections track collections of cross sections. Note that selections refer to cross section definitions and not to survey cross sections. i.e. a selection refers to positions on the river where cross sections are measured and not to the particular measurements from one survey or other. In this way, selections can be used to retrieve cross sections from any survey. It is recommended that users manage the contents of this table via the cross section viewer software and do not edit its contents directly.
SelectionValues - This is an intersect table between Selections and CrossSections. This table tracks which cross sections are part of each selection. A cross section can be part of many selections, but can only be used once in each selection. It is recommended that users manage the contents of this table via the cross section viewer software and do not edit its contents directly.
CRPs - Construction reference planes (CRP) represent a collection of inflection points that are used as a datum on which the river is referenced against. Each CRP is represented by multiple inflection points. Administrators can edit this table and add, remove or rename CRPs as needed. Note that the cross section viewer displays the CRPs in reverse alphabetical order and so it’s recommended that the year of the CRP is always used as the first part of the name. This ensures that the newest (and potentially most relevant) CRP always appears first, and as the default, in the software.
CRPValues - CRP elevations represent the inflection points along a CRP. Each CRP has multiple CRP elevations. Users can edit this table but should always retain at least two records for each CRP.
LongProfiles - Long profiles represent a line down the channel. These are typically used for features such as Thalwegs or sailing lines.
LongProfileValues - Represents individual points that belong to a long profile. Each point is associated with a particular survey cross section. That is, they are tied to a particular point in time and survey. Points are identified by a particular cross section, station along the cross section and elevation.
RiverDistances - There is one record in this table for each location on the Missouri River that represents a whole river mile. The location is identified by the latitude and longitude in decimal degrees.
BendNames - Each of the major bends on the Missouri River between river mile zero and 500 have a record in this table.
Metadata - Stores information about the status of the database including, the date it was released, the latest version number etc. Users should not edit this table since it is used by the software to detect the compatibility of the database with the software itself.
The following instructions describe how to add reference stations into a Cross Section Viewer database. The software does not automate this process and so it requires manual manipulation of the data and inserting them by hand into the database in question.
Reference Station data refer to individual cross sections, meaning this process requires that you know the database ID of each cross section. This is only practical if you are adding just a handful of data points. However, it can be burdonsome if you have lots of data, in which case we recommend the bulk data process described at the bottom of this page.
Preparation
This process requires writing SQL commands to insert data into the database. You will need a database software tool to execute these commands. We recommend one of the following. The first two are free, lightweight tools.
Make a copy of the Cross Section Viewer database that you intend to change. Simply create a zip archive as a precaution to something going wrong and you needing to recover the previous version.
Step 2 - Create a new Reference Station Type
Open the database software that you selected from the list above.
Connect to the Cross Section Viewer database that you wish to change.
Open the StationTypes table.
Add a new row and enter the Tilte of the new Reference Station type. Also enter an integer specifying how many station values you expect to provide for each cross section. Typically this is 1 or 2. Also enter your name in the AddedOn and UpdatedOn fields. You do NOT need to provide a TypeID or the date fields.
Save and commit the record.
Note down the new TypeID generated by the database. (Depending on which software you are using you might need to refresh the data table contents before this is visible.)
Step 3 - Insert Reference Station Data
Open the StationValues table and enter the new reference station values into this table using the following values:
ReferenceID - Do not enter a value for this field. The database will provide this value.
CrossSectionID - the ID of the cross section for which the reference station value applies. If you are unsure of the CrossSectionID to use, they can be found in the CrossSections database table.
TypeID - This is the value noted down at the end of the previous step.
Station - This is the new reference station value. Note that it must be in the same units as the rest of the cross section database being altered. Use the Database Info to determine this if you are unsure.
Bulk Data
The process described above if only practical if you have a small number of records to enter. If you have lots of cross sectioyns you can build a text file of SQL commands to perform Step 2. The following example shows an example of a text file for inserting Rectified Channel Line data. Note how each cross section ID appears twice; once for the left RCL station and a second time for the right RCL. Note that the TypeID for the new Reference Station Type in this example is 5.
You can copy and paste the contents of the text file into one of the database softwares listed above and execute this command to insert thousands of data values in one operation.
The following database contains Missouri River bathymetric cross section data from 1994 to 2020. The level of QA/QC of the data varies. This data is provided AS IS. USACE makes no guarantee of its correctness or suitability for any given purpose.
In 2018 the Cross Section Viewer was updated to use SQLite as the database underlying the software, instead of Microsoft Access. Should you want to interact with a Cross Section Viewer database directly (writing custom SQL queries etc) then you essentially have two options:
SQLite
SQLite is natively a command line application with no user interface. However there are several free user interfaces available that provide rich user interfaces to SQLite databases. SQLite Studio is one such free user interface that possesses an excellent database browser and query functionality.
SQLite Studio does not need to be installed. You simply download the software, extract the zip archive anywhere on your system and then run it.
Microsoft Access
You can use Microsoft Access as the user interface to view and edit data stored in a SQLite database. To do this you have to set up an ODBC file source to the SQLite database and then add linked tables to an Access database that reference the SQLite database. Essentially Access becomes the user interface through which you interact with your data, but the actual data itself are stored in SQLite.
2) Open ODBC. This is a built-in piece of software that comes with all versions of Windows and allows you to connect to virtually any database format. The easiest way to open ODBC is to press the Windows key and then type “odbc”. Windows comes with both a 32 and 64 bit version and you should make sure that you select the 64 bit version of ODBC!
3) Make sure that you are on the “User DSN” tab and then click the Add... button.
4) Scroll down and choose the SQLite3 ODBC Driver.
5) Provide a meaningful name for this data source, something like “Cross Section Viewer” and then browse to the SQLite database file (*.xsdb). All other settings can be left untouched.
6) Click OK to create the ODBC data source. You will return to the list of datasources with the new one selected.
7) Open Microsoft Access.
8) Create a new, blank Access database. You can save it anywhere but it makes sense to place it in the same folder as the SQLite database.
9) Click the External Data tab.
10) Click the ODBC Database button.
11) Click the Option to Link to the datasource by creating a linked table.
12) In the Select Data Source popup that appears, switch to the Machine Data Source tab and select the ODBC data source that you created in the earlier step. Then click OK.
13) A window will appear that shows all the tables in the Cross Section Viewer SQLite database. Select the ones that you are interested in, hold the Shift key to multi-select, or click the Select All button to link to all the SQLite tables.
14) Click OK.
The end result of all these steps is a very small Access database that links to the relevant tables in the SQLite database. You can query, add, edit, delete data in Access and the changes will actually occur back in the SQLite database. You can also use all of Accesses features to filter records, create new queries etc. Note that the Access database is extremely small. It doesn’t contain any actual data, but simply the links back to the SQLite database. (This is relevant if you want to email or share the Access database between colleagues or computers.)
/Tutorials/1_viewing_exporting_xs.html
1. Viewing and Exporting XS
An engineer calls you up and asks for “bathymetry from river mile 358 to 361.” Your task is to see what data is available and to view and export the data for that reach of the river.
Task 1 - Open the Cross Section Viewer Software
Click the Windows key on your keyboard and then start typing the name of the software “cross section viewer”. The start menu should filter your installed software to just the Cross Section Viewer software. Click the icon or name to launch the Cross Section Viewer.
Task 2 - Open the Missouri River sample database
Click on File -> Open Database and then browse to the location where you have saved the Missouri River database. Once you click OK the path to the database should appear in the bottom left status bar of the main Cross Section Viewer software window.
Task 3 - Investigate the available survey years in the database
Click on the Data menu and then Surveys to see a list of all the surveys contained within the current database.
How many different surveys are in the database?
Task 4 - Investigate which years contain a specific cross-section
Click on the Data menu again and this time choose Cross Sections. This will display a list of each cross section defined in the current database together with summary information about the river distances and how many times it has been surveyed.
How many different surveys include a cross-sectional measurement at river mile 358.94?
Task 5 - View cross sections at river mile 358.94
5.1 Select Tools -> Plot Cross Sections
5.2 Click on the top-most survey, then shift-click on the bottom-most survey to select all the surveys
Scroll down the list of cross sections and select 358.94
Cross section 358.94 is displayed for each year it was surveyed. The display is too crowded. Deselect all years except for 2008 and 2014. The easiest way is to click on the year 2008 then control-click on 2014.
What happened at this cross-section between 2008 and 2014?
Did nearby cross-sections behave similarly?
Click on adjacent cross sections. Notice that the 2014 survey did not include every cross section.
What happened at 359.02?
What happened at 358.85?
Close the Plot Cross Sections tool.
Task 6 Build a selection set of only 1994 cross sections
6.1 Select Data -> Selections
6.2 Create a new selection by choosing Edit -> New
6.3 Call the selection “1994” then choose the “Plus” button
6.4 Select “By Survey” in the “Attribute” drop down. Select 1994. Push OK. Close the Selections window.
6.5 Go back to Tools -> Plot Cross Sections
6.6 Under the Cross Section Selections drop-down, select the 1994 selection.
The list of cross sections will only contain cross sections that were surveyed in 1994.
6.7 Select years 1994 and 2013.
Scroll through the list and find a cross-section that:
Degrades significantly from 1994 to 2013? (list river mile)
Aggrades significantly from 1994 to 2013?
Remains fairly stable from 1994 to 2013?
Close the Plot Cross Sections window.
TASK 7 Create a new selection that includes river miles 358 to 361.
7.1 Select Data -> Selections
7.2 Select Edit -> New
7.3 Name the selection and click the “plus” sign.
7.4 Under Attribute, select “River Mile”. Leave filter set to “Between.”
7.5 Choose a downstream river mile of 358 and an upstream of 361. Leave all other options as is and click OK twice.
How many cross-sections are in this selection?
Close the Selections window.
7.6 Select Tools -> Export Cross Sections
7.7 Choose the selection you just created. Leave the Export Format as “CSV.”
7.8 Click on the Surveys tab. Click on the top-most survey and shift-click the bottom most survey to select all the surveys.
7.9 Click OK.
Each survey will be saved in a separate CSV file. The survey being exported is indicated at the top of the window.
In the interest of time, save only the 1994 survey. Uncheck the box next to the other surveys.
7.10 Open the .csv file with Excel.
How many bathymetric data points are there? (count the number of rows minus the header)
Scenario: You want to determine the percentage of total bed degradation from 1994 to 2013 that is directly attributable to commercial sand and gravel extraction (channel mining). Assume 89 million cubic yards of commercial sand and gravel extraction.
Click the Windows key on your keyboard and then start typing the name of the software “cross section viewer”. The start menu should filter your installed software to just the Cross Section Viewer software. Click the icon or name to launch the Cross Section Viewer.
Task 2- Open the Missouri River Sample database.
Click on File -> Open Database and then browse to the location where you have saved the Missouri River database. Once you click OK the path to the database should appear in the bottom left status bar of the main Cross Section Viewer software window.
Task 3- Create a new selection using only the 1994 cross sections.
(You might already have one.)
3.1 Select Data -> Selections
3.2 Create a new selection by choosing Edit -> New
3.3 Call the selection “1994” then choose the “Plus” button
3.4 Select “By Survey” in the “Attribute” drop down. Select 1994. Click OK.
Close the Selections window.
Task 4 - Compute Volume Change from 1994 to 2013
4.1 Select Tools -> Longitudinal Change
4.2 Choose the “1994” selection from the “Selection” drop-down list.
Note: If you use a selection that contains all the cross sections, the software will still only include cross-sections that occur in both surveys. It just takes longer to process.
4.3 Choose the “2013” for the “New” survey and “1994” for the “Old” survey.
4.4 Select “Common cross section extents” (default) for “Station Filtering” and “Max cross section elevation at river mile” (default) for vertical filtering
4.5 Set the “Upstream” to 500 and “Downstream” to 0.
Setup should be as follows:
Click “Update Plot”
Approximately how much total volume of bed material degraded from 1994 to 2013 for River Miles 498 to 351.6?
Approximately how much total volume of bed material degraded from 1994 to 2013 for River Miles 498 to 10?
4.6 Export the data used to make the graph by selecting Plot-> Export Data
**4.7 Bring the .txt file you just created into Microsoft Excel.</span>
What is the total volume change between RM 498 and 6?
What is the total volume change between RM 497.46 and 495.94?
There are two ways to do this. Either sum the control volume changes starting with the value with 497.46 in the “upstream” column and ending with 495.94 in the “downstream” column or subtract the downstream cumulative from the upstream cumulative change value, only looking at the “downstream” column. i.e. either sum the italic values or subtract the bold in the example below:
New Survey: 2013
Old Survey: 1994
Downstream river mile
Upstream river mile
Control volume change
Cumulative volume change
498
0
0
0
497.84
498
231
231
497.74
497.84
-317628
-317397
497.56
497.74
-703613
-1021010
497.46
497.56
-48001
-1069011
496.94
497.46
-1193093
-2262104
496.8
496.94
-887222
-3149326
496.27
496.8
-2429084
-5578410
496.03
496.27
-1793332
-7371742
495.94
496.03
-587796
-7959538
495.66
495.94
-2635084
-10594622
495.46
495.66
94761
-10499860
495.37
495.46
-351816
-10851676
494.95
495.37
391648
-10460029
494.81
494.95
-970735
-11430763
What is the percentage of total bed change from 1994 to 2013 directly attributable to commercial sand and gravel extraction for the full lower 498 miles?
/Tutorials/3_depth_distribution.html
3. Depth Distributions
Scenario: You want to compare the prevalence of shallow water habitat (areas with depth less than 5ft) in two, 20 mile reaches of the river. Reach 1 is 390 to 370. Reach 2 is 310 to 290.
Click the Windows key on your keyboard and then start typing the name of the software “cross section viewer”. The start menu should filter your installed software to just the Cross Section Viewer software. Click the icon or name to launch the Cross Section Viewer.
Task 2 - Open the Missouri River Sample database.
Click on File -> Open Database and then browse to the location where you have saved the Missouri River database. Once you click OK the path to the database should appear in the bottom left status bar of the main Cross Section Viewer software window.
Task 3 - Select Tools -> Surface Area and Depth Distributions-> Reach Area / Depth Distribution
Task 4 - Compute the Depth Distribution
4.1 For Survey, select 2013
4.2 For Selection, choose an appropriate selection that will include all cross-sections in the 2013 survey.
All cross sections will work, or a 2013 selection will work.
4.3 For Water surface, select the 2010 CRP.
This is where you could select a different water surface if desired, i.e. a 2-year flow, a Bankfull “water surface”, navigation flow, etc.
4.4 Under analysis parameters: Depth increment = 5, Upstream river mile = 500, downstream river mile = 0.
The first time you run it, the river miles will revert to something else.
4.5 Click “Compute”
Task 5 - Change the River Miles to the reaches of interest and click compute again.
Reach 1 (390 to 370): What is the approximate area (ac) with depth less than 5 ft?
Reach 2 (310 to 290): What is the approximate area (ac) with depth less than 5 ft?
Task 6 - Is the difference between these two reaches a consistent difference or tied to the specific survey?
Re-do the analysis with the 2014 survey to find out.
Reach 1 (390 to 370): Approximate area (ac) with depth less than 5 ft?
Reach 2 (310 to 290): Approximate area (ac) with depth less than 5 ft?
What is the danger of using this tool on these data sets to compare shallow water habitat levels from year 2013 to 2014?
Scenario: You just won a contract to write a report on the geomorphic changes in Worthwhine Chute. You are going to automate many of the analyses for the report using the Cross Section Viewer.
Task 1 - Open the .csv file containing your data (WorthwhineChute_Data.xlsx).
The Cross Section Viewer can import survey data in several formats. Note that each cross section is designated in survey format (0+00, 1+00 etc.) with one cross section every hundred feet.
Task 2 - Create a new database for Worthwhine Chute.
2.1 Open the Cross Section Viewer software. Select File -> Create New Cross Section Survey Database
Click the Windows key on your keyboard and then start typing the name of the software “cross section viewer”. The start menu should filter your installed software to just the Cross Section Viewer software. Click the icon or name to launch the Cross Section Viewer.
2.2 Name the river Worthwhine Chute, elevation units in US survey feet, vertical datum NAVD88.
You have the option of creating the database with cross sections identified as an integer, as a river mile, or in stationing format. Since our data is in stationing format, select that option.
Click “Create Database.” You do not necessarily have to match the database type to your survey data.
Call the template “Worthwhine 2013” or something similar. Select the “River stationing” option. Click “Create Database.”
Task 4 - Fill the survey template with the 2013 data
4.1 In Windows Explorer, browse to your “Worthwhine 2013” database template. Open in Access.
4.2 Double-click on the “survey points” table. A blank table will appear.
4.3 Open your .csv file.
Re-order (if necessary) to ensure that the correct columns are present and are in the same order as the table. Note: The column labeled “Offset” reports the perpendicular distance from the surveyed point to the target transect line. This field is computed using GIS and is a quality control metric when using boat-mounted single-beam sonar in moving water. If you don’t have this data (or don’t care about this data) you can fill the column with 0s.
Select the data (not the headers) and copy.
4.4 In Access, click on the light and dark triangle in the top right corner of the table. Control-V to paste in the data. Click Yes when Access asks if you want to paste in the data.
How many rows of data were pasted in?
Does this match the number of data points in the .csv file?
Note: Although the software allows you to specify a vertical datum, this is meta data only. There are no internal conversion processes to correct for different elevation datums. Surveys from different years should be converted to a consistent datum prior to import into your database.
Close Access and Excel.
Task 5 - Import the Filled Template
5.1 In the XS Viewer, in the “Surveys” window, select Edit -> Add
5.2 Name the survey “2013”
5.3 With the “2013” survey selected, chose Edit -> Import -> Import Populated Template
5.4 Browse to your populated template (e.g. Worthwhine 2013), choose “Existing survey” and 2013, and click OK.
5.5 A window pops up listing the new cross sections that are in the import file that are not in the survey in the database. Select “Add new cross sections” and click “Continue.”
How many XS are in the survey?
What is the min and max river mile?
5.6 Close the Surveys window.
TASK 6 - Create a selection
6.1 Choose Data -> Selections
6.2 Choose Edit -> New
6.3 Title the selection, “2013” and click the green “Plus” button.
6.4 Select “By Survey” for the attribute and select the 2013 survey. Click OK twice. Close the Selections window.
Task 7 - Import a water surface or other reference plane
7.1 Select Data -> Construction Reference Planes
7.2 Select Edit -> Import -> Create Empty Template. Name the data base “CRP2010.”
CRP is the “Construction Reference Plane” on the Missouri River. On another river, this could be “Bankfull” “2-year Flow” or any other water surface or sloping reference plane of interest.
Task 8 - Extra Problems
8.1 Plot cross sections 68+00, 70+00, and 72+00.
Click on the Edit menu and export the image for the chart and save to your computer.
8.2 Import the survey labeled 20XX. (See Tasks 3, 4, and 5).
8.3 Perform a volume change from 2013 to 20XX for river miles 0 to 1.
(Note that the longitudinal change tool expects a river mile, even though the cross sections are in 00+00 format.)
This software was originally conceived and built for a pre-existing database of survey cross sections for the Missouri River, but has since been made flexible for use on other rivers. The Kansas City District of the USACE has funded this development through the Bank Stabilization and Navigation Project, Missouri River Recovery Program, Section 204 CAP Authority, and the Regional Sediment Management program.
The Cross Section Viewer is a standalone, desktop software application. To install it you download and run the setup.exe application linked below. This will install the Cross Section Viewer in your user profile folder (not the Windows Program Files folder). Read the release notes for information on the latest features and updates.
40Mb free disk space for the software, plus enough space to store cross section databases.
Installation Process
Click on the link above to download the Cross Section Viewer software setup.exe file. Some internet browsers will warn about the potential risks of downloading executable files (see below). Check that the warning refers to the Cross Section Viewer file and then click to keep the file.
Once the setup.exe file download is complete, double click the file to run the installation routine and follow the prompts to complete the process. There are no options or choices during the installation.
Note that the Cross Section Viewer does not require Administrator privileges to install and does not place any files in the C:\Program Files folder. The entire application is stored in the user’s profile folder.
Obtaining Updates
The Cross Section Viewer software automatically checks for newer versions every time the software is launched. When a newer version is detected the user is prompted to install it.
Note that clicking cancel turns off the automated check permanently and the software will no longer prompt when newer versions are available.
There is also a manual “Check for Updates” feature on the Help menu in the software.
Manual Installation
USACE security prevents the Cross Section Viewer from running when it is installed using the method described above. Users that experience this problem (typically manifested by a message saying that the SQLite.Interop.dll file cannot be found) should use the following procedure to download and run the Cross Section Viewer:
Create a folder on your computer called CrossSectionViewer. Preferably this should be somewhere near the root of your hard drive (i.e. not nested within several folders). It’s also recommended that you avoid folder names with spaces and other special characters (periods etc). This folder must NOT be inside your user profile folder or on your Desktop!
Download the latest version of the software as a zip file using the link below.
Unzip the the zip file into the folder that you created in step 1.
Double click the file CrossSectionViewer.exe to launch the Cross Section Viewer software. Once the software has started, it’s recommended that you right click on the application on the task bar and either pin it to the task bar or the start menu. Alternatively you can drag a short cut to the CrossSectionViewer.exe file to your desktop or some other helpful location. Either approach is intended to make it quicker to launch the software when you need it.
If you still experience problems with Windows Defender blocking the software from running then right click on the exexcutable and check the “Unblock” checkbox then click OK.
This manual approach to installing the software means that you will not be able to check for - or automatically apply - updates when they become available. You are encouraged to check this site frequently for new releases.
If you have the software installed manually and discover a newer version is available, then simply close the Cross Section Viewer software, delete all the files in the folder where you unzipped them and repeat the process described above to download and unzip the latest version. You can have multiple versions installed using this method but it is strongly discouraged.
/glossary.html
Glossary
Average Elevation - Determined by calculating the area of the cross section and dividing it by the top width and subtracting from the top width elevation.
Bed Length - The sum of the lengths between each survey point along the cross section
Calculate and Store Cross Section Metrics – Cross Section Viewer calculates the cross section metrics to be used by tools within the software. This should be performed on any new database
Calculate Cross Section Spacing - Cross Section Viewer calculates the cross section spacing to be used by tools within the software. This should be performed on any new database
Closest Bank - L indicates that the defined station is closest to the channel margin left bank. R indicates the right bank
Construction Reference Plane (CRP) - A sloping datum on the Missouri River representing the stage, or water surface elevation met or exceeded 75% of the time during navigation season (source). In the software, any sloping datum is referred to as a CRP. It need not conform to the Missouri River definition.
Cross Section – Elevation vs. station at a transect across the river of a particular location along the river (i.e. river distance).
CRP Elevation - The elevation (in feet) of the sloping datum (called the CRP) at a given cross section.
Elevation - The vertical distance above a defined datum, typically sea level.
Lateral Change - Tool that generates plot of Bed Change vs. Depth Below Reference Plane between two Surveys with additional filtering by Selection, Reference Plane, Station, Cross Section, Plot Type. Used to describe how cross sections change with relation to depth or distance from a defined station (like a thalweg).
Long Profile - The long profile shows how a river’s gradient changes as it flows from its source to its mouth (source)
Longitudinal Change – Tool that generates plot of Cumulative Volume Change vs. river distance for given Selection with additional filtering by Survey, Station, Vertical (Max cross section elevation) and river distance.
NAVD88 - “Is the vertical control datum of orthometric height established for vertical control surveying in the United States of America based upon the General Adjustment of the North American Datum of 1988” (source)
NGVD29 - “The Sea Level Datum of 1929 was the vertical control datum established for vertical control surveying in the United States of America by the General Adjustment of 1929. The datum was used to measure elevation (altitude) above, and depression (depth) below, mean sea level (MSL) … Since the Sea Level Datum of 1929 was a hybrid model, it was not a pure model of mean sea level, the geoid, or any other equipotential surface. Therefore, it was renamed the National Geodetic Vertical Datum of 1929 (NGVD 29) in 1973” (source).
Offset - The Euclidean distance of the point that was actually surveyed from the position on the monumented cross section that it represents*.
Reference Stage – A fixed, horizontal line at a particular cross section.
Reference Station - One or more fixed vertical lines on a cross section.
River Bend - A knee or a meander in a river.
River Distance - The longitudinal position of the cross section along the river.
Sailing Line Distance - The high precision longitudinal position of the inflection point. Used to compute actual distance between cross sections.
Selections – A subset of available cross section locations. Also the name of the tool within the Cross Section Viewer that allows the user to create selections of cross sections based on desired attributes.
Station - The distance of the survey point from the left bank.
Survey - A database record which includes information about the river survey including its name (often the date the survey was performed), extent of the survey (maximum and minimum river distance), number of cross sections, and any remarks.
Survey Width - The euclidean distance between the first and last survey point.
Vertical Datum - Vertical datum used for the cross section elevations (software currently allows for NAVD88 and NGVD29).
Whole River Miles - Points along the river corresponding with exact miles.
/
Home
The Cross Section Viewer is an interactive software application for managing and visualizing river transect data. The software uses a simple data model that allows most types of transect data to be stored and viewed. A series of interactive tools include areal, profile and longitudinal plots as well as several geomorphic calculations that would typically take a user a considerable amount of time to produce.
Features
Store virtually unlimited number of surveys, cross sections and points in a simple, structured database.
View graphical plots of each cross section, along with reference stations and stages.
Calculate and report many common river measurements, including:
Transect areas.
Incremental and cumulative depth distributions.
Longitudinal volumes with planimetric areas and volumes - both incremental and cumulative.
Bed elevation change - both total volume and average vertical change.
Import survey data from CSV text files or HEC-compatible formats.
Export survey as well plot data into CSV and HEC-compatible text file formats.
View cross sections on an interactive map.
Citation
If you use the Cross Section Viewer, please cite the following publication:
The notes below describe the enhancements and fixes for each release of the most recent Cross Section Viewer software. The release notes are also available for versions
1,
2 and
3.
4.0.3 - 23 Feb 2023
Fixing lateral change tool to warn when no reference plane is selected and to also ignore reference stations and long profile if those options are not selected.
4.0.2 - 23 Nov 2021
Fixing mean bed elevation. Removing division by 2.
4.0.1 - 15 Sep 2021
Fixing x axis labels of surface area plot.
4.0.0 - 22 Mar 2021
New splash screen that appears when the software first loads offering quick route to popular features.
Database schema update with metadata columns for storing JSON metadata for all top level entities.
Survey CSV import and export now includes survey point codes ofr each survey point.
Survey CSV import and export now background processes with progress bars.
Editing cross section survey notes, metadata and survey date.
Selections can be created from CSV of river distances.
Multiple cross sections can be removed from a selection.
Editing survey metadata.
/support.html
Support
This site is the primary support resource for the cross section viewer. Use the Online Help section for instructions on how to use the software and the Technical Reference for understanding the calculations used to report the various results shown throughout the software.
Personalized Support & Training
Contact the Cross Section Viewer development team should you wish to purchase personalized support or training.
Reporting Issues
We use GitHub issue tracking for asking questions and getting help as well as reporting bugs. You can search the forum for past issues without a login, but to post to the forum you will need to create a free GitHub account. Please take care to review the existing open issues and avoid logging items that are already being tracked.
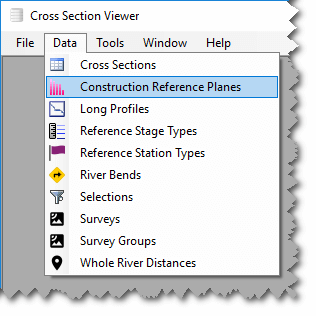
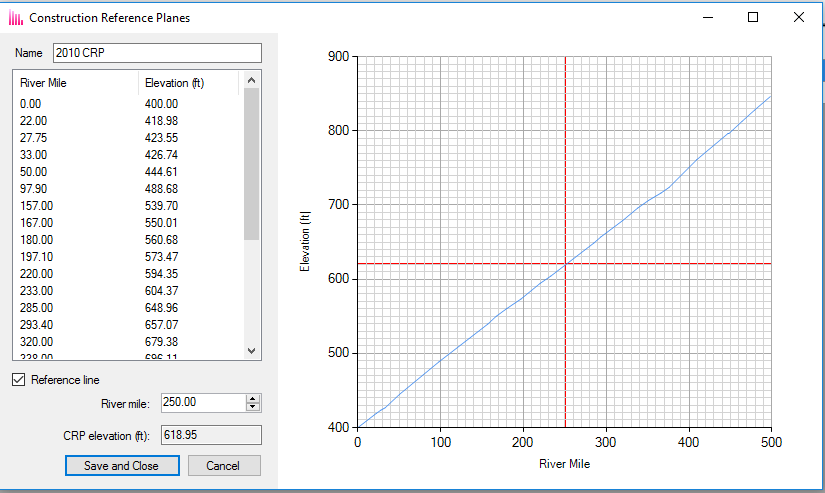
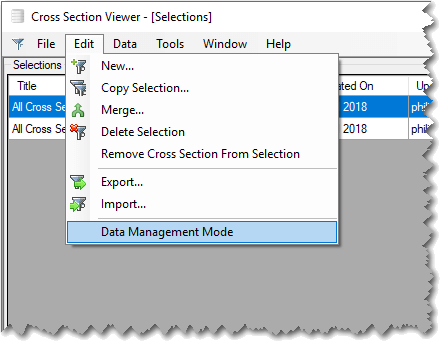
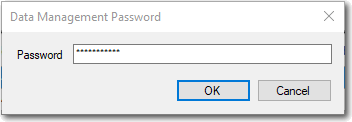
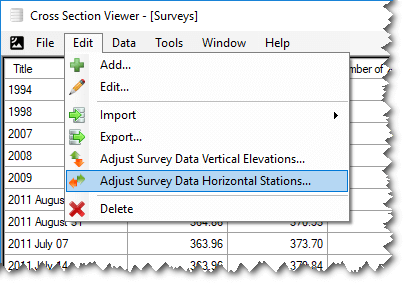
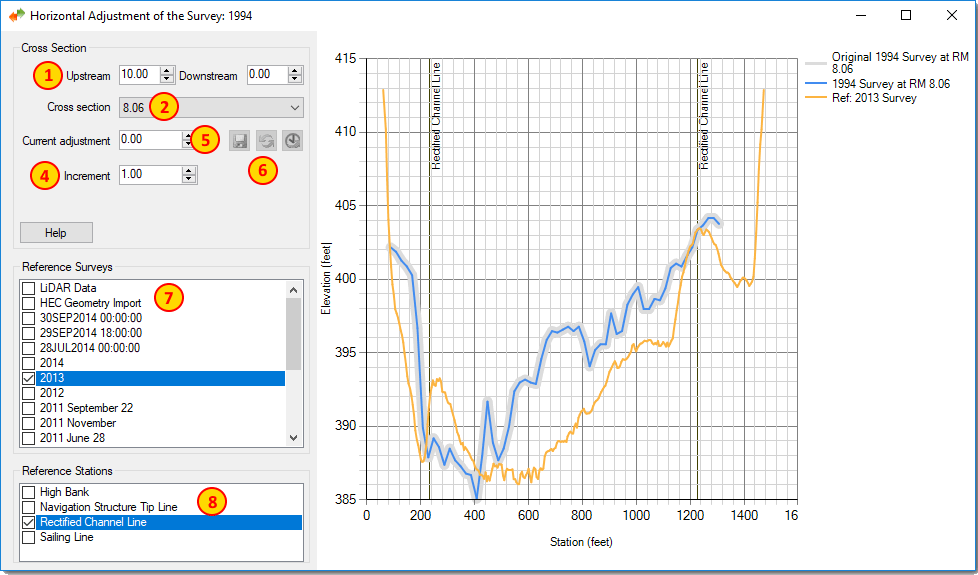
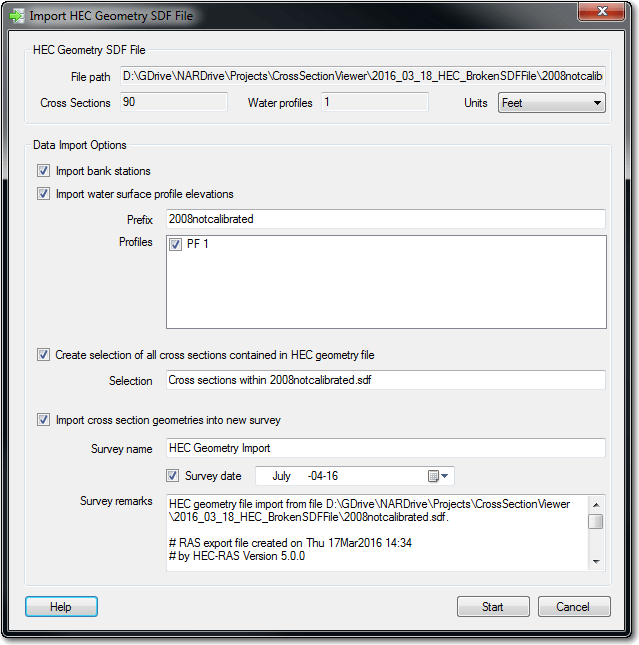
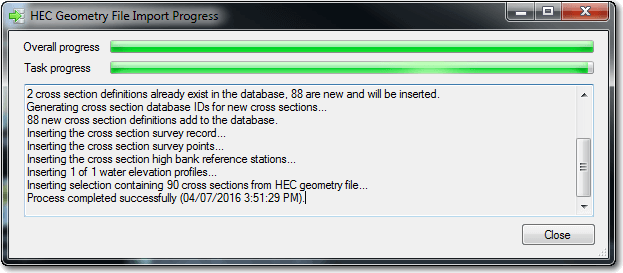
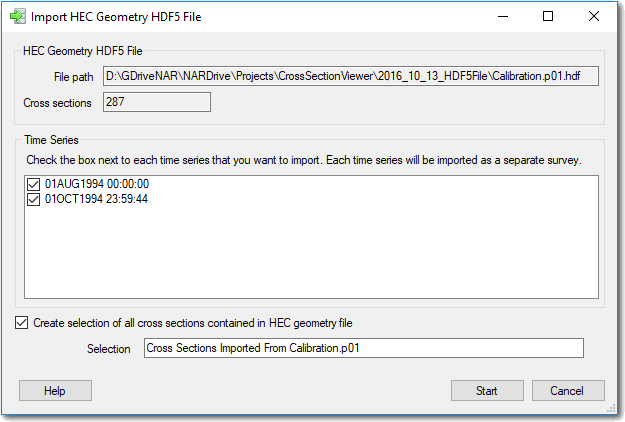
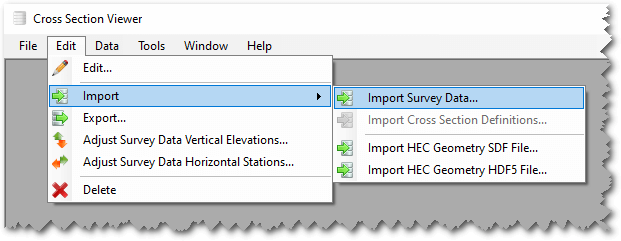
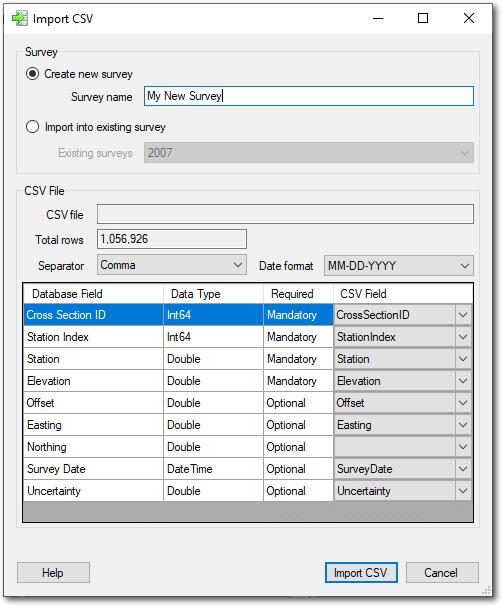
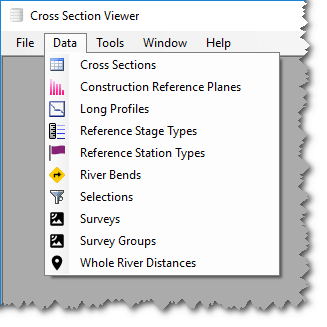
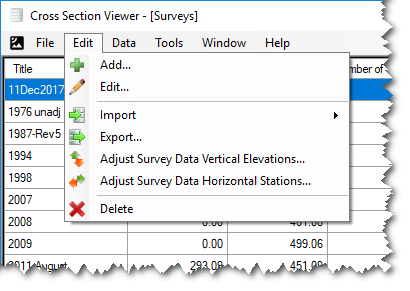
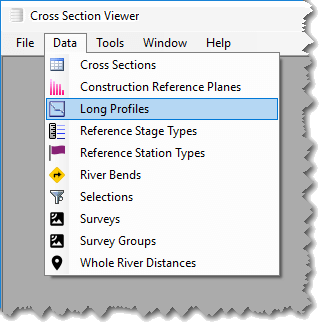
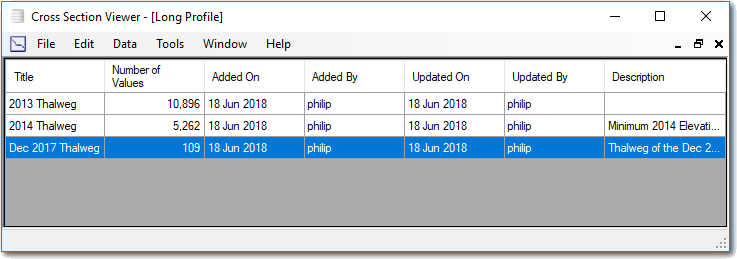
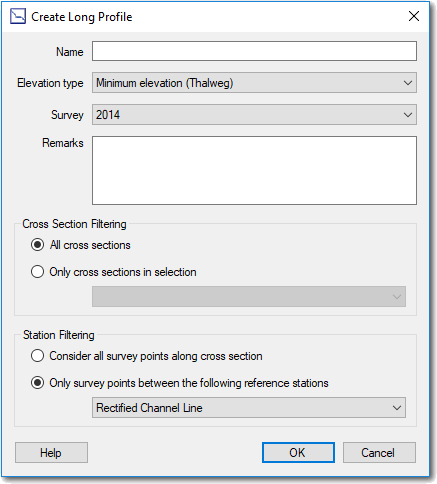
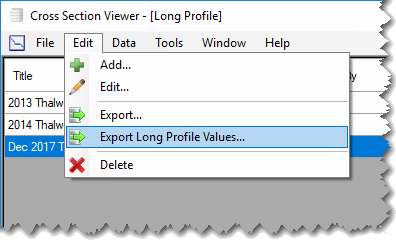


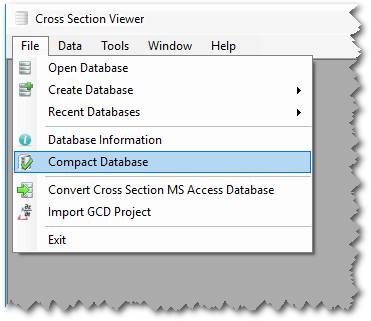
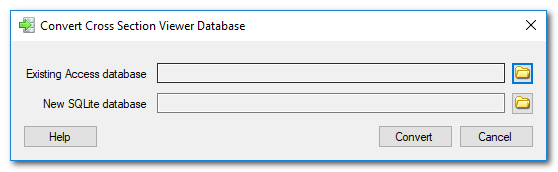
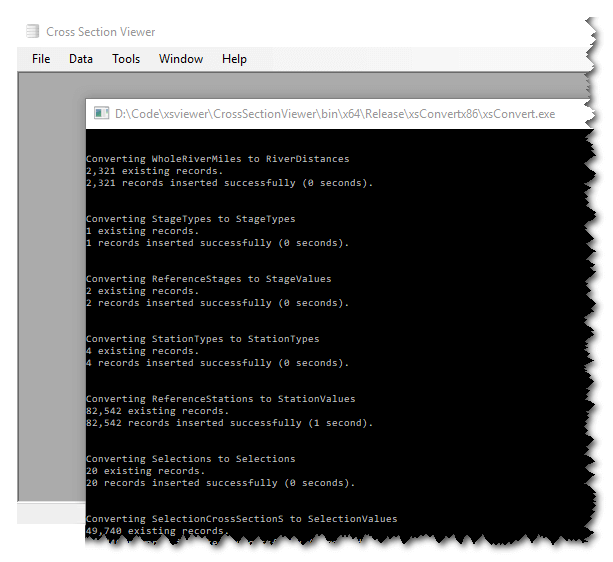
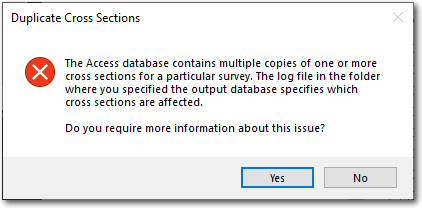
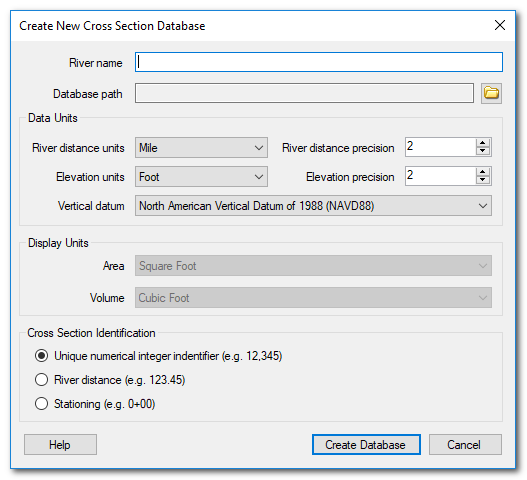
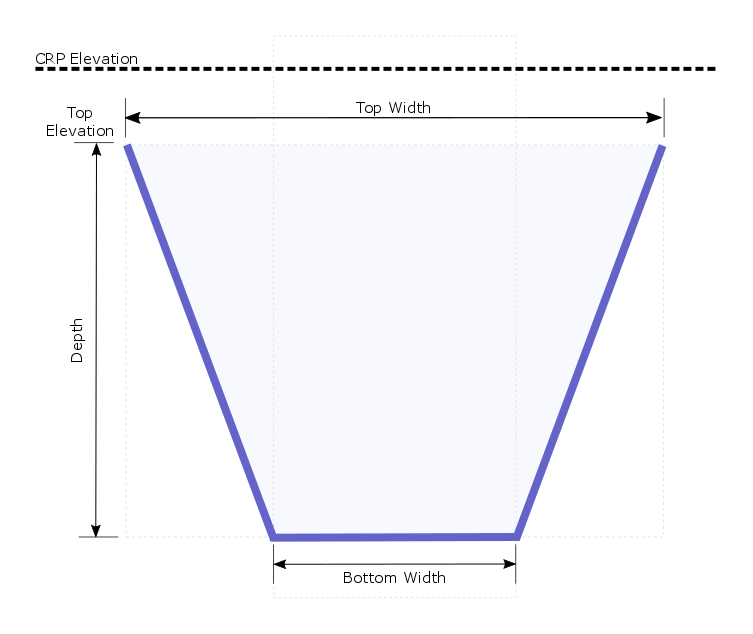
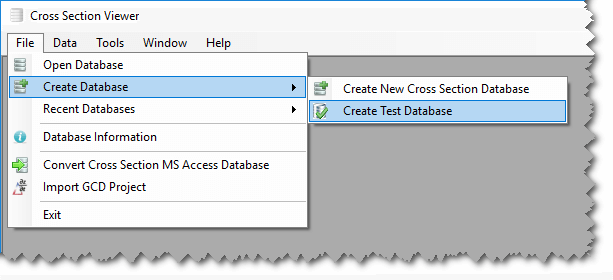
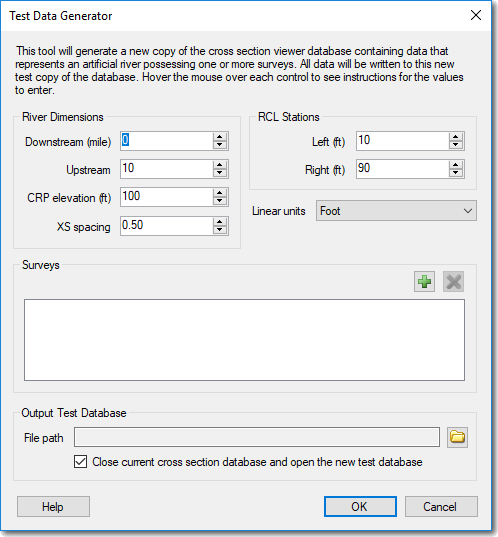
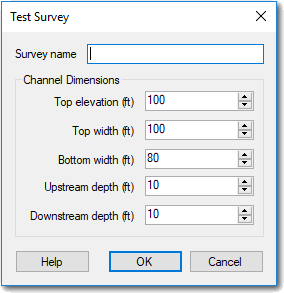
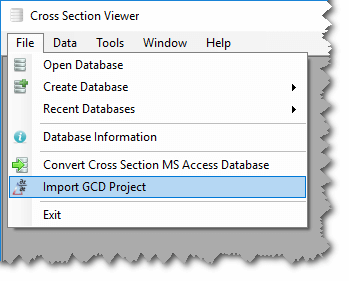
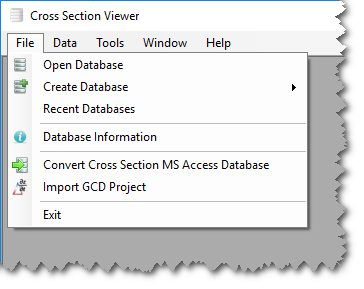
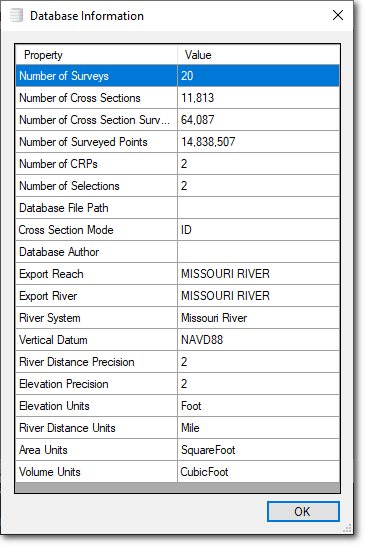
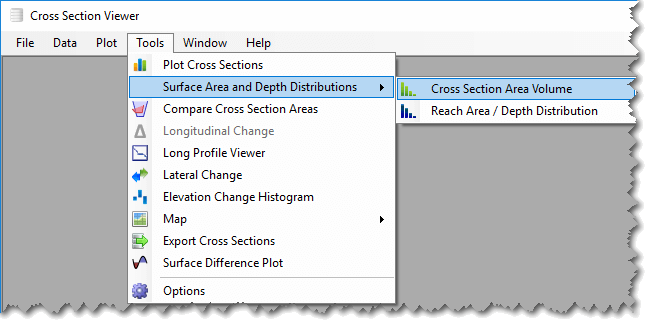
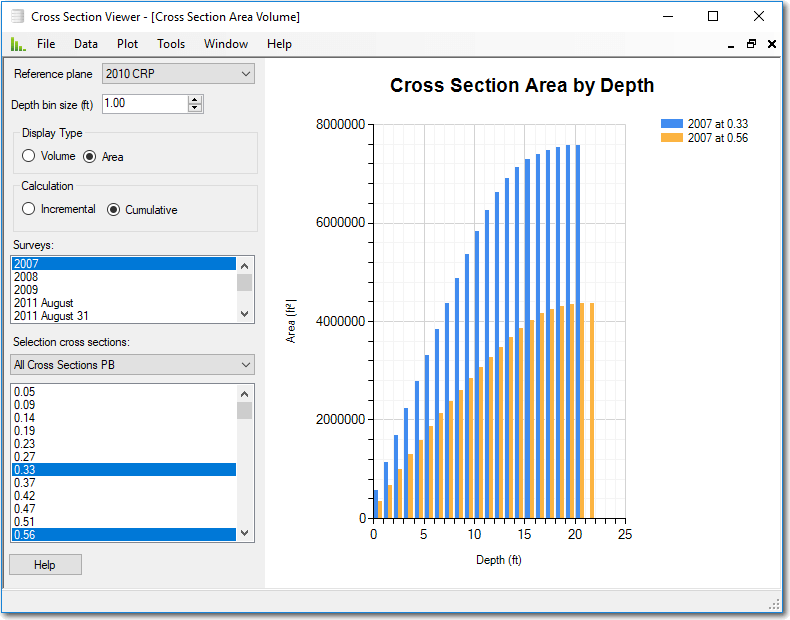


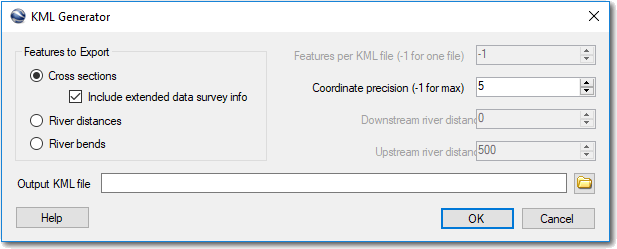
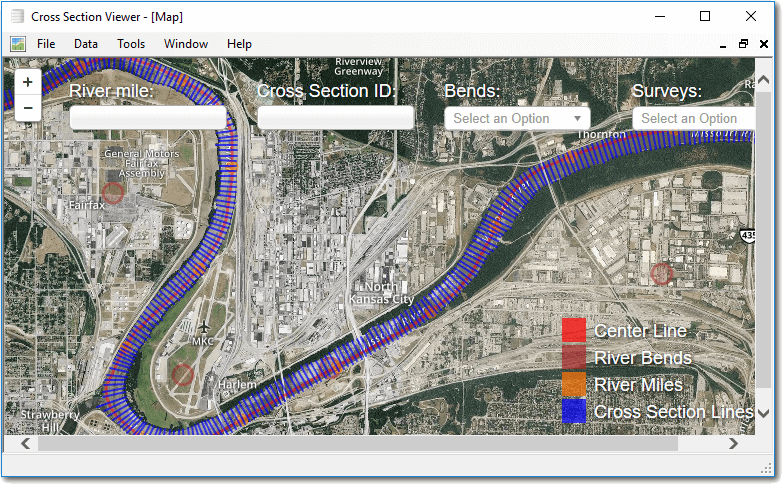
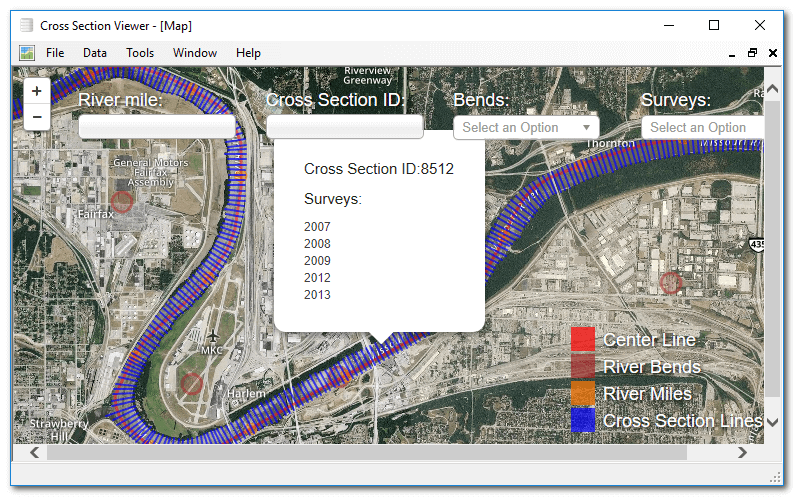
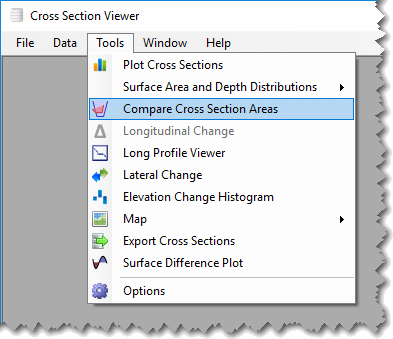
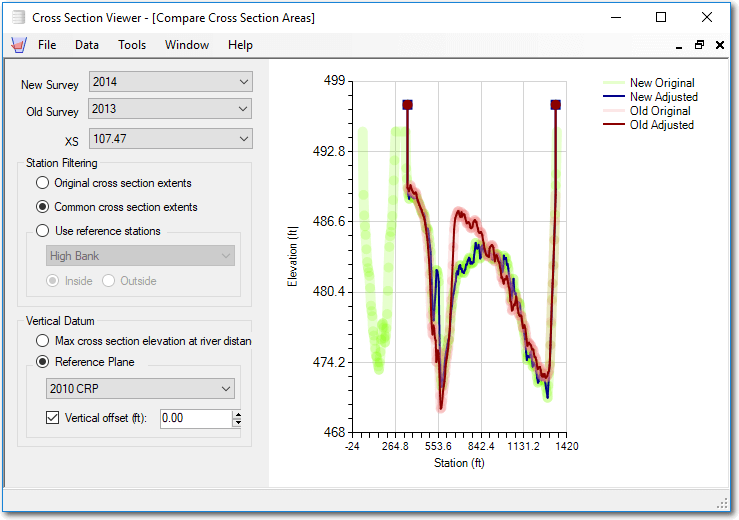
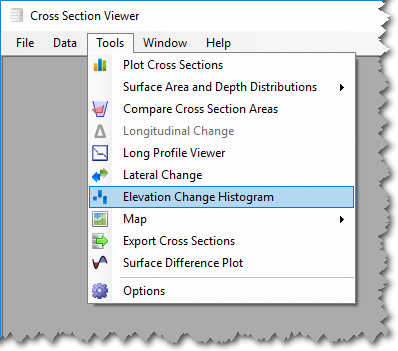
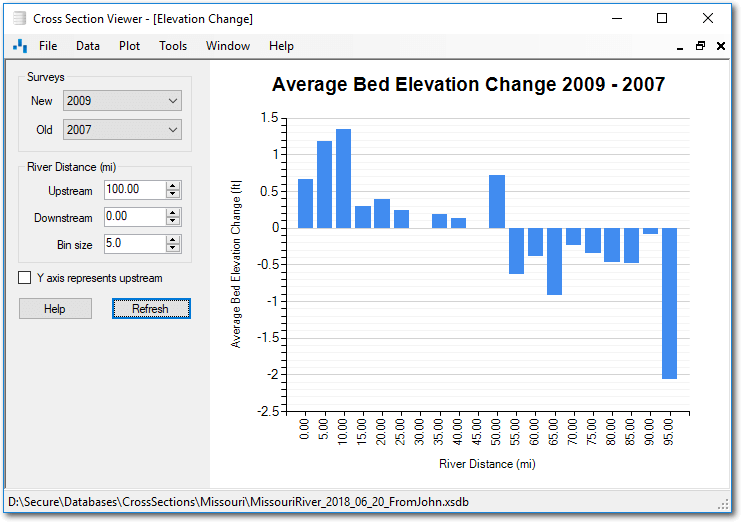
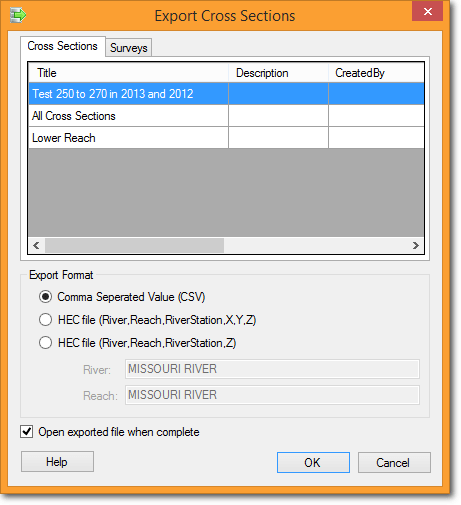
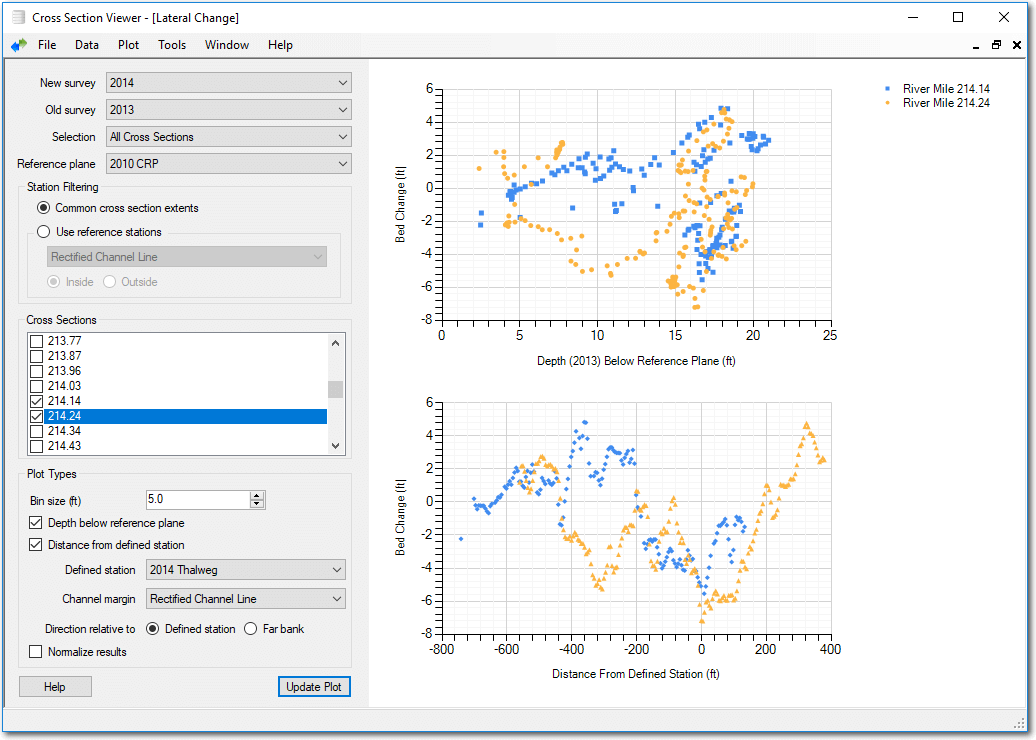
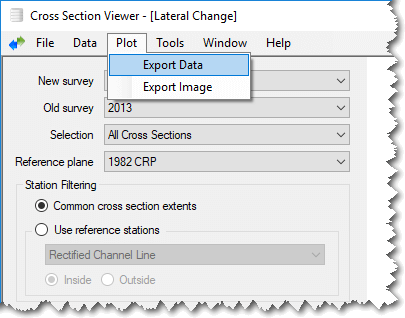
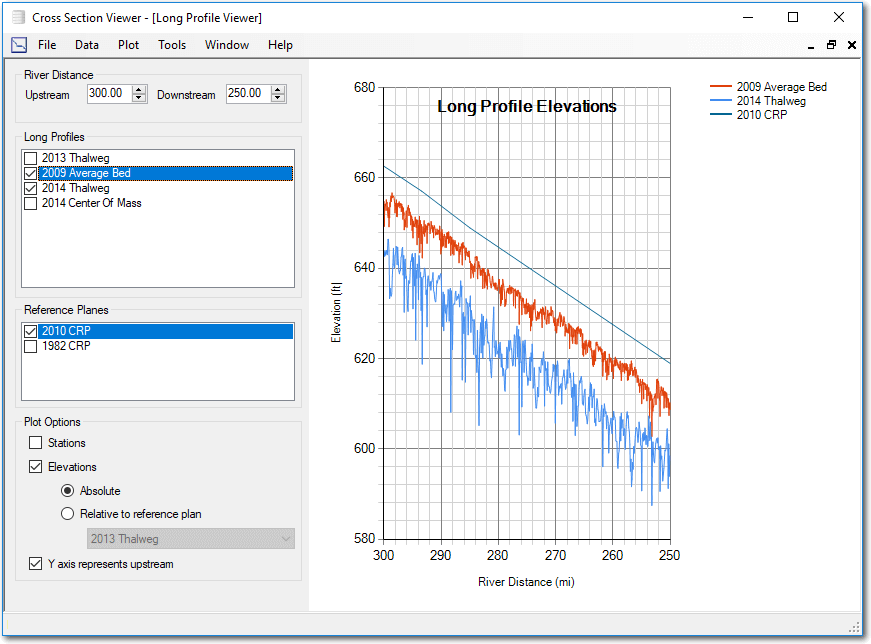
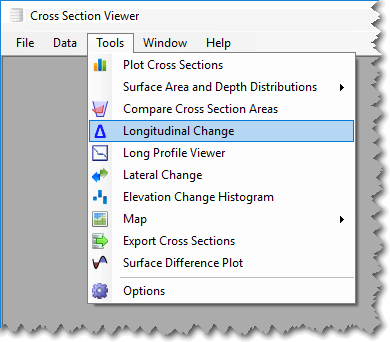
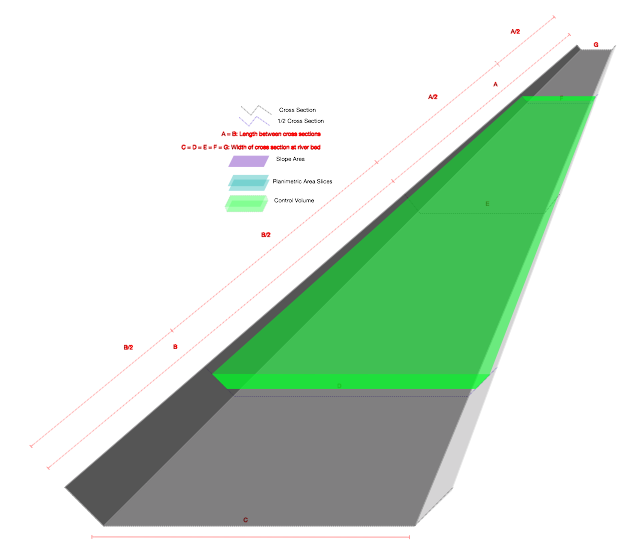
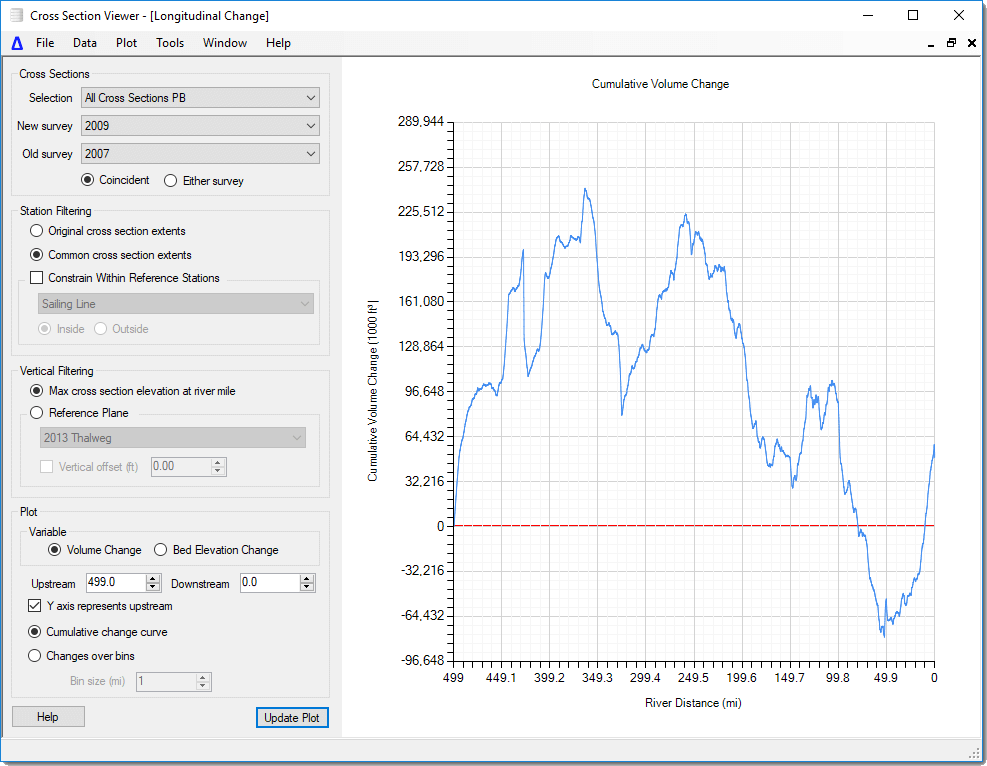
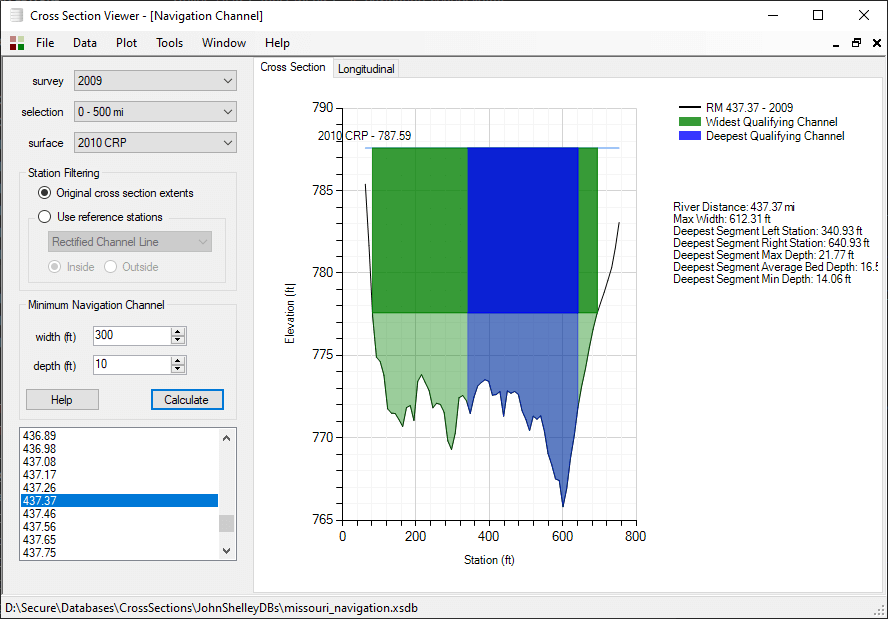
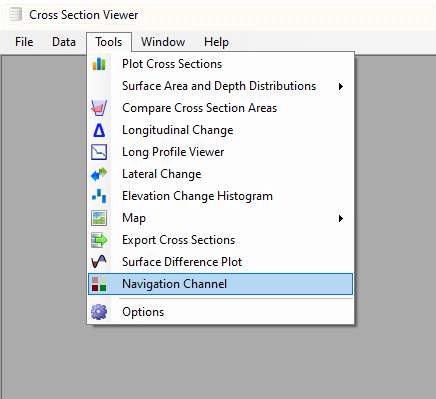
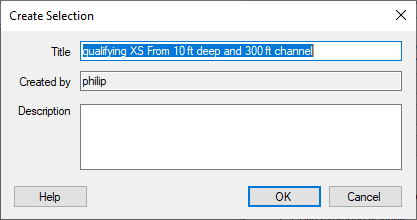
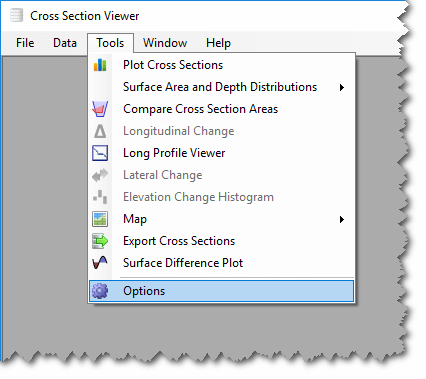
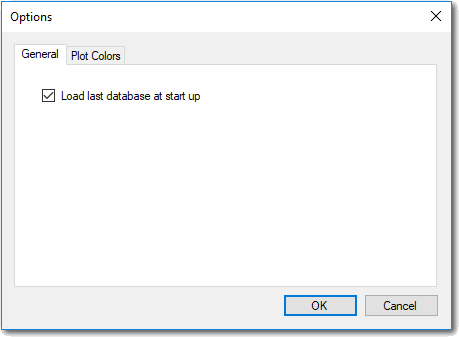
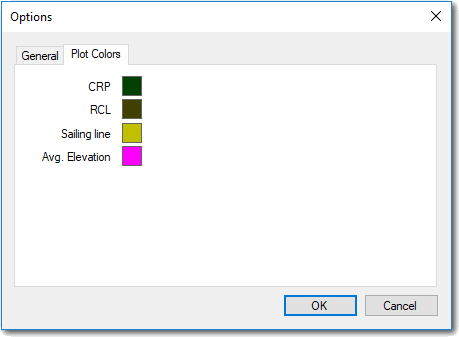
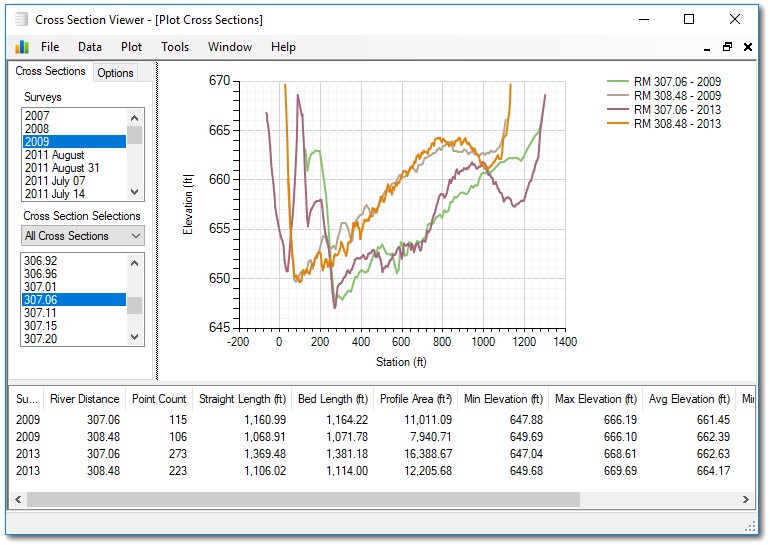
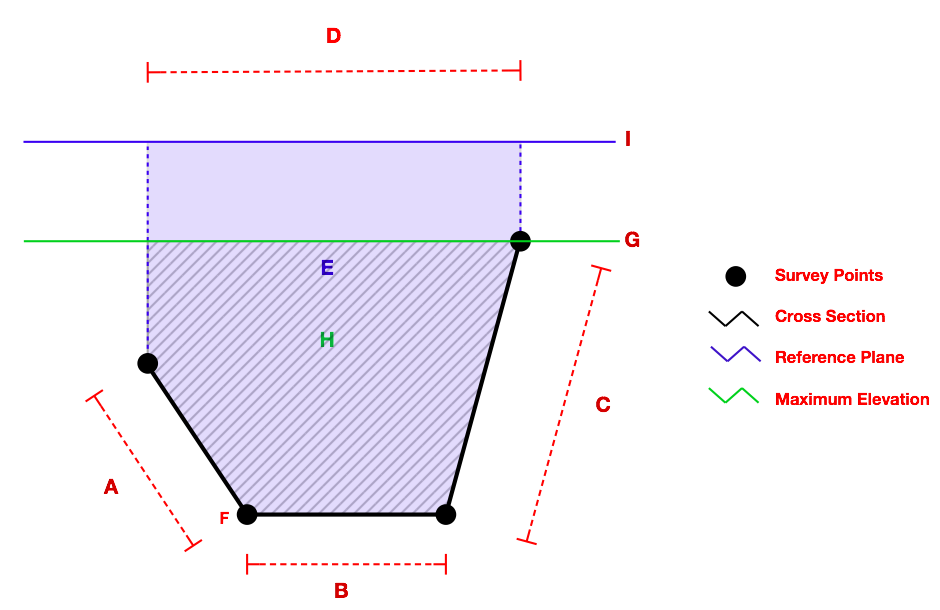
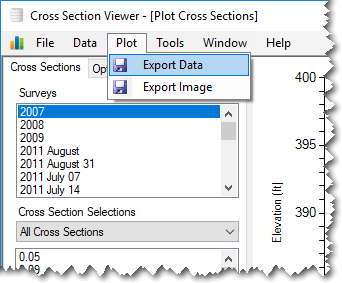
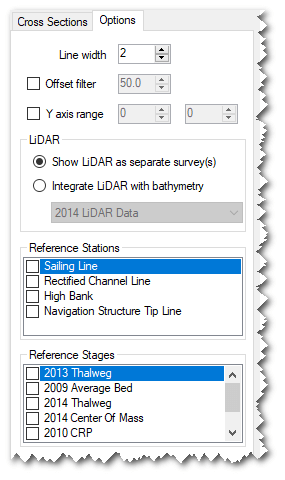
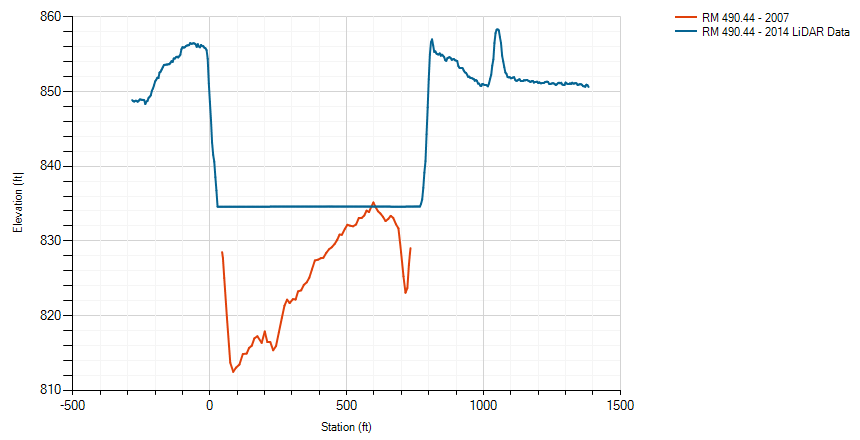
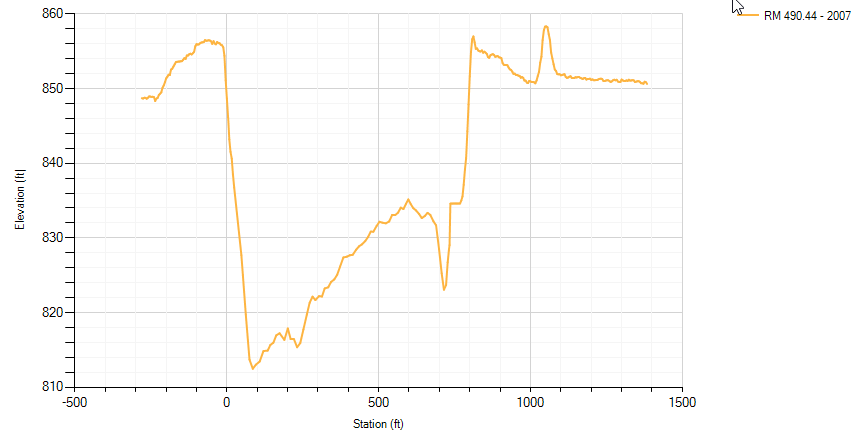
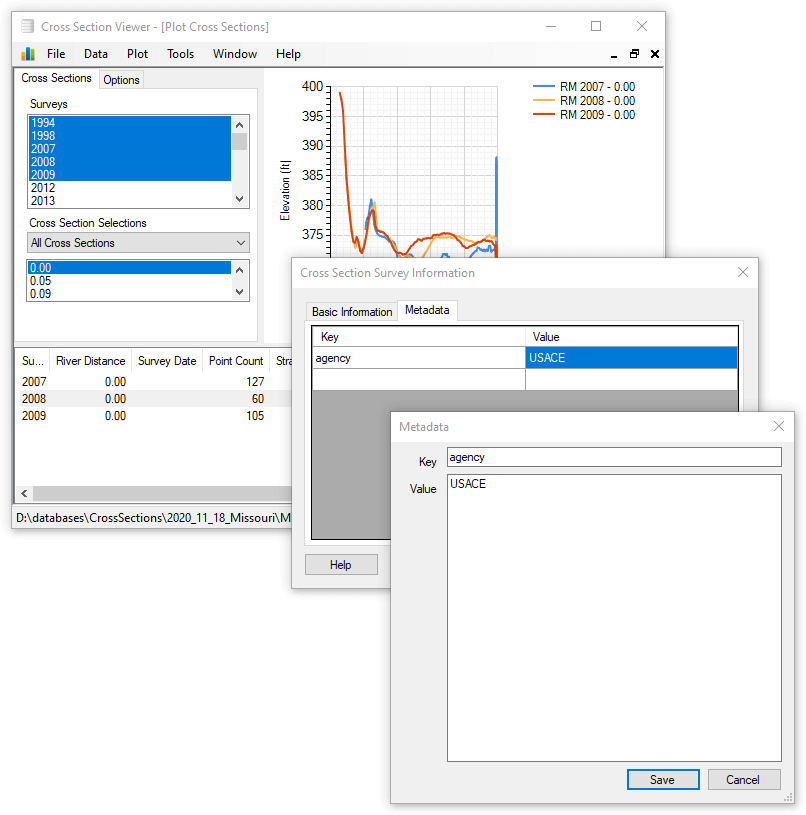

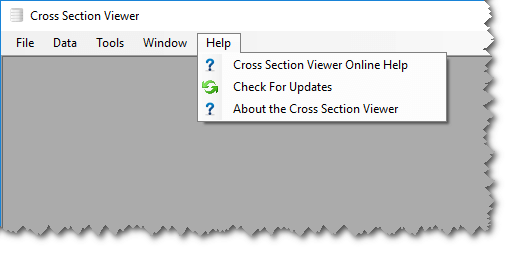

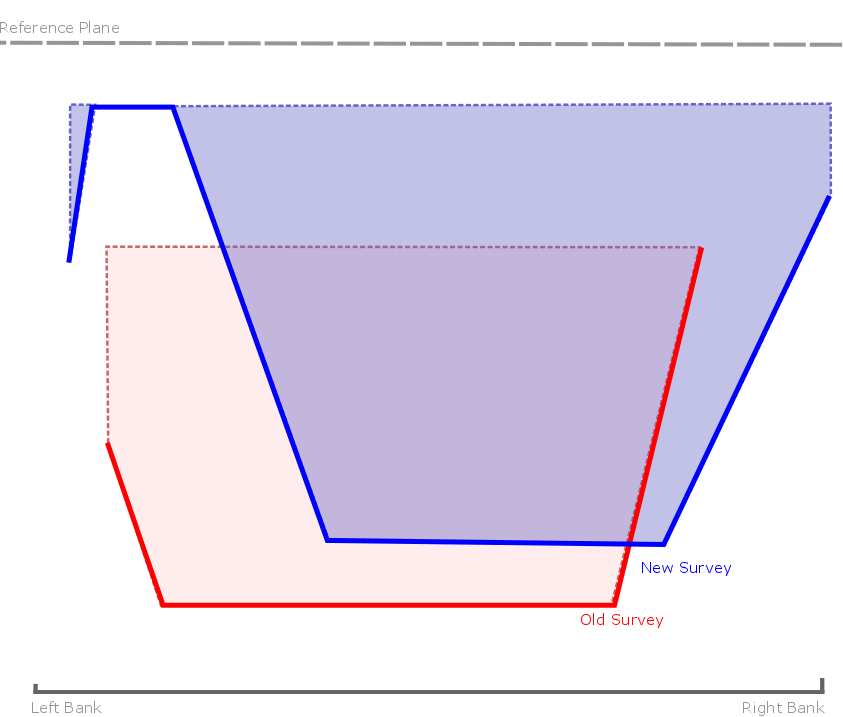
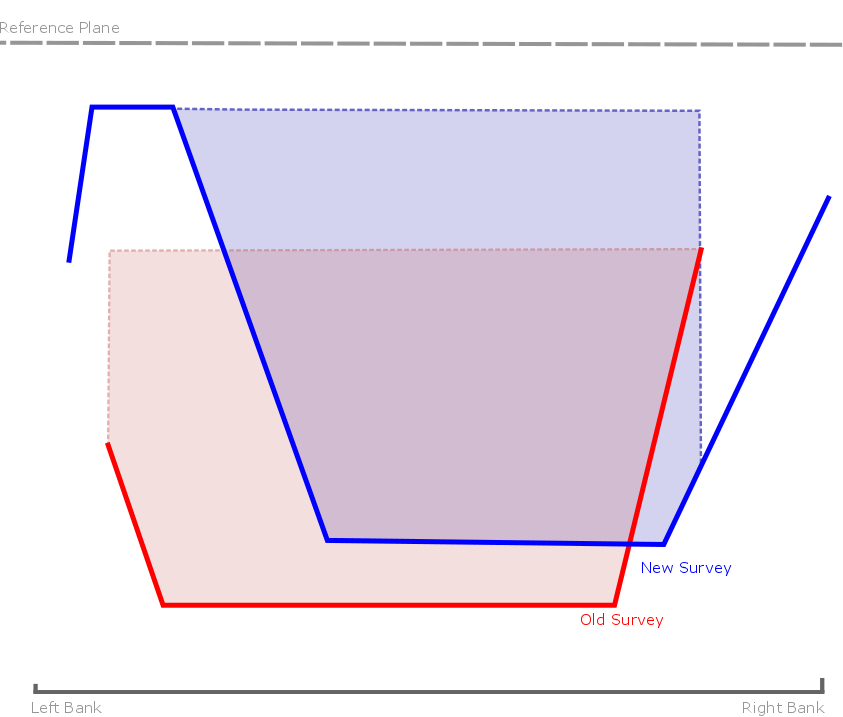
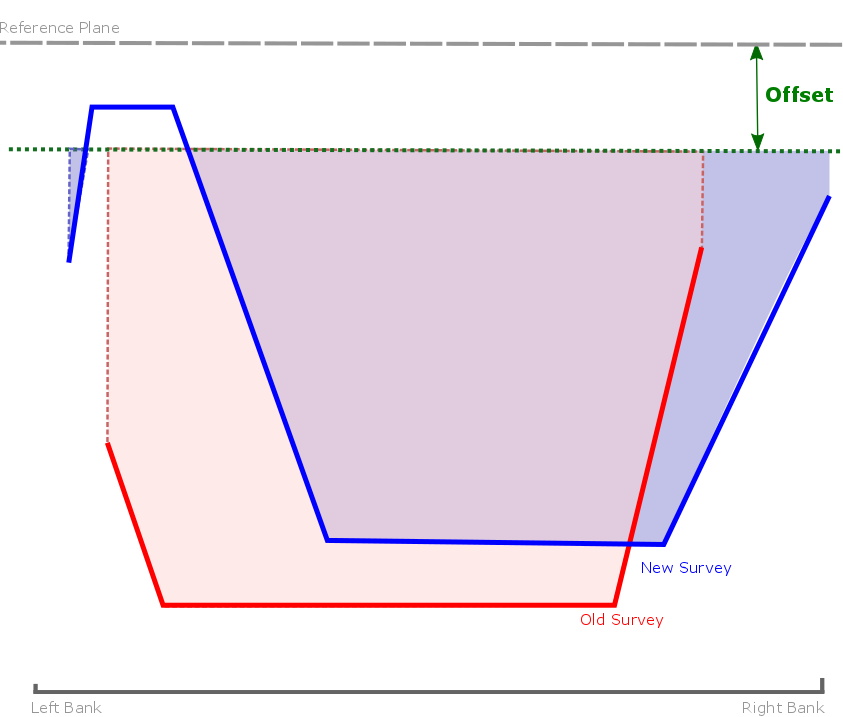
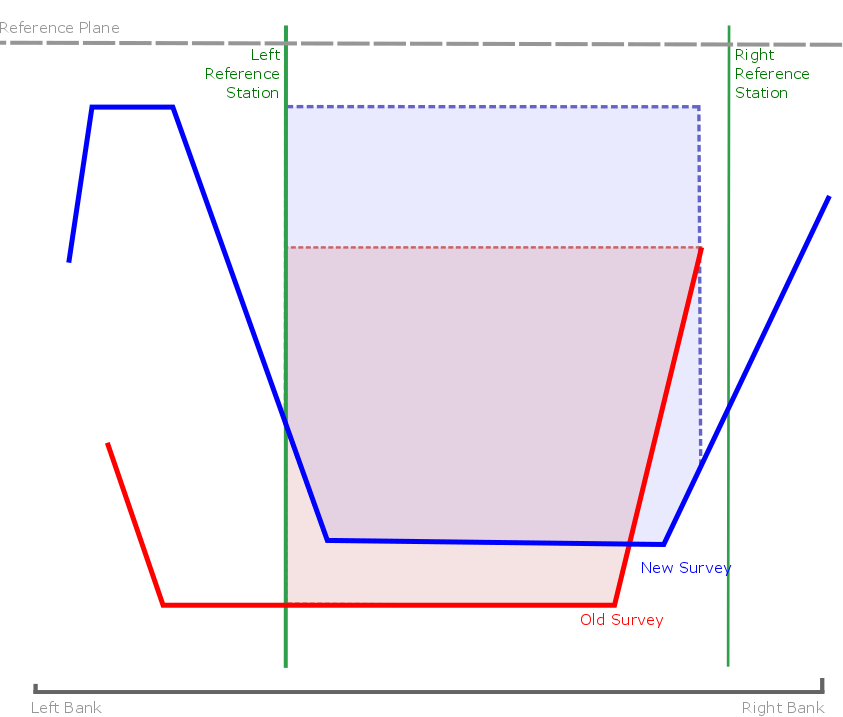
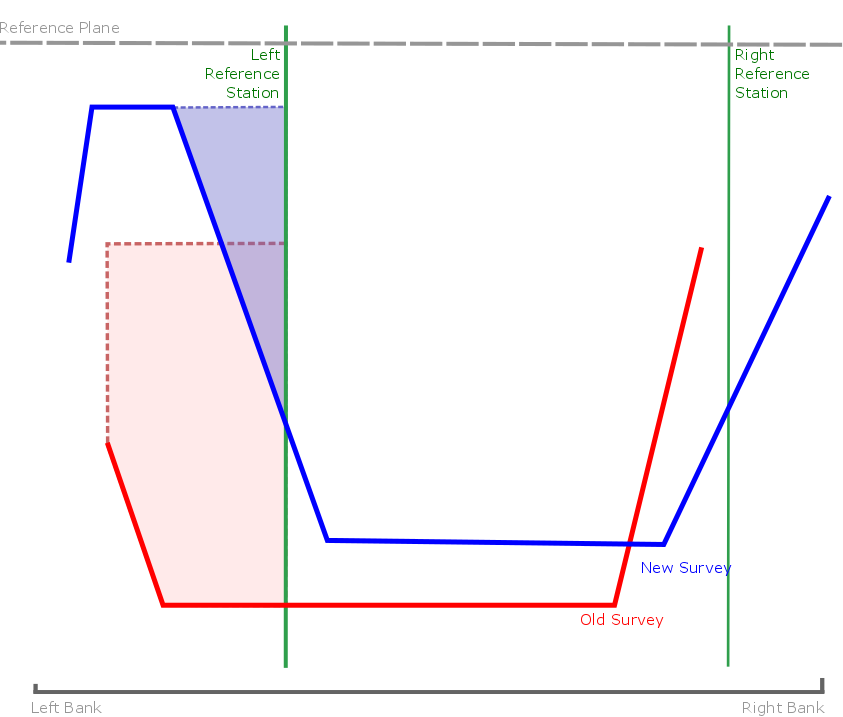

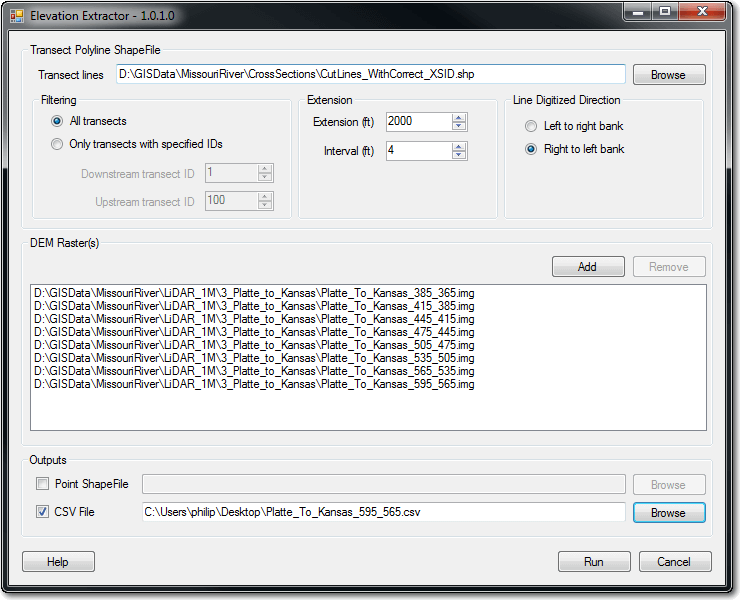
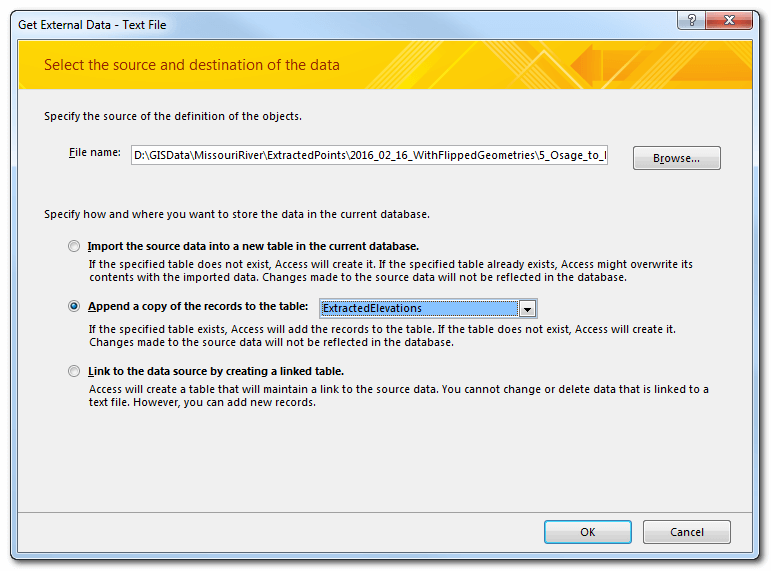
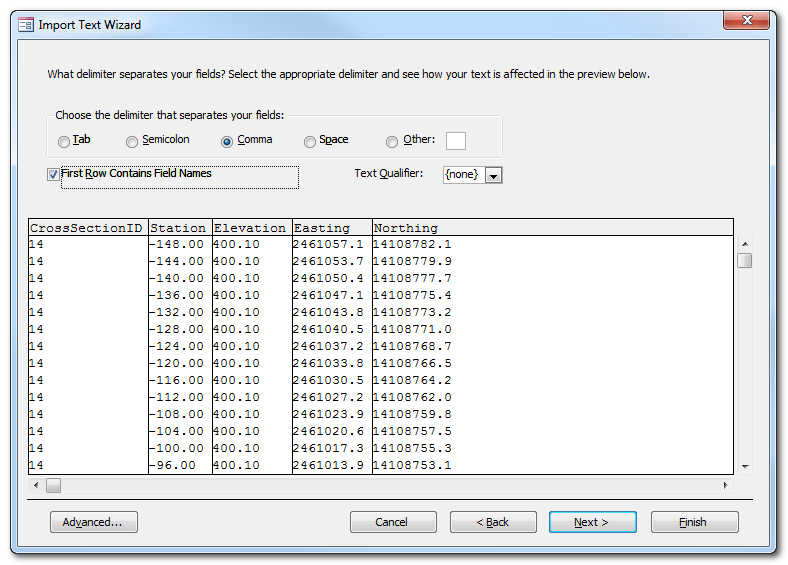
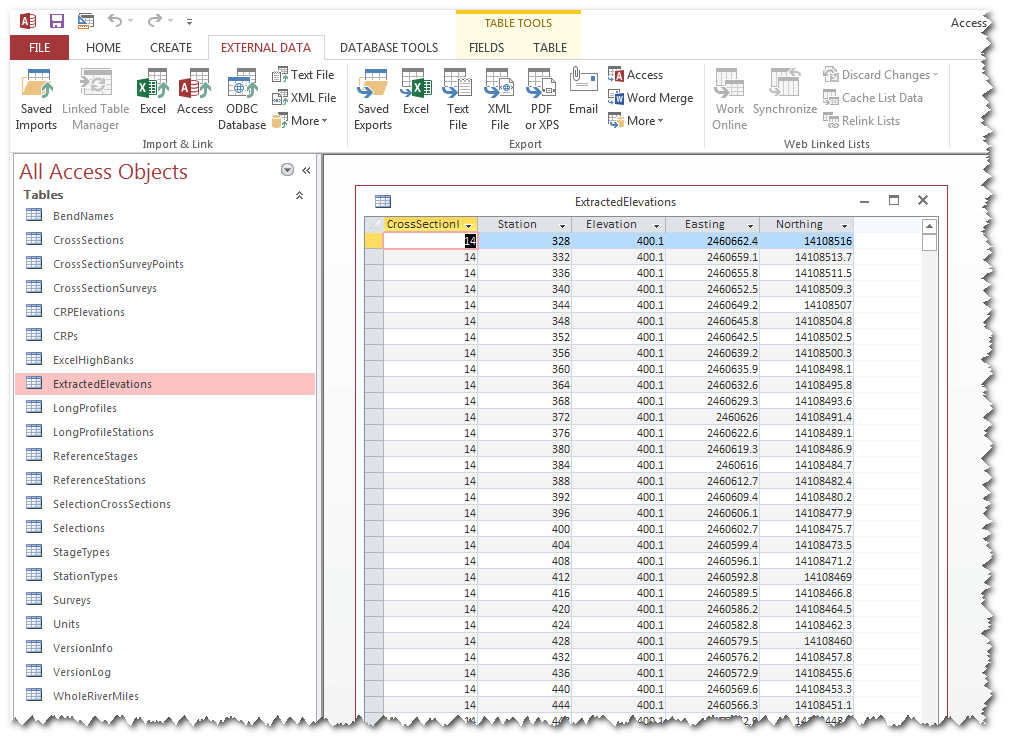
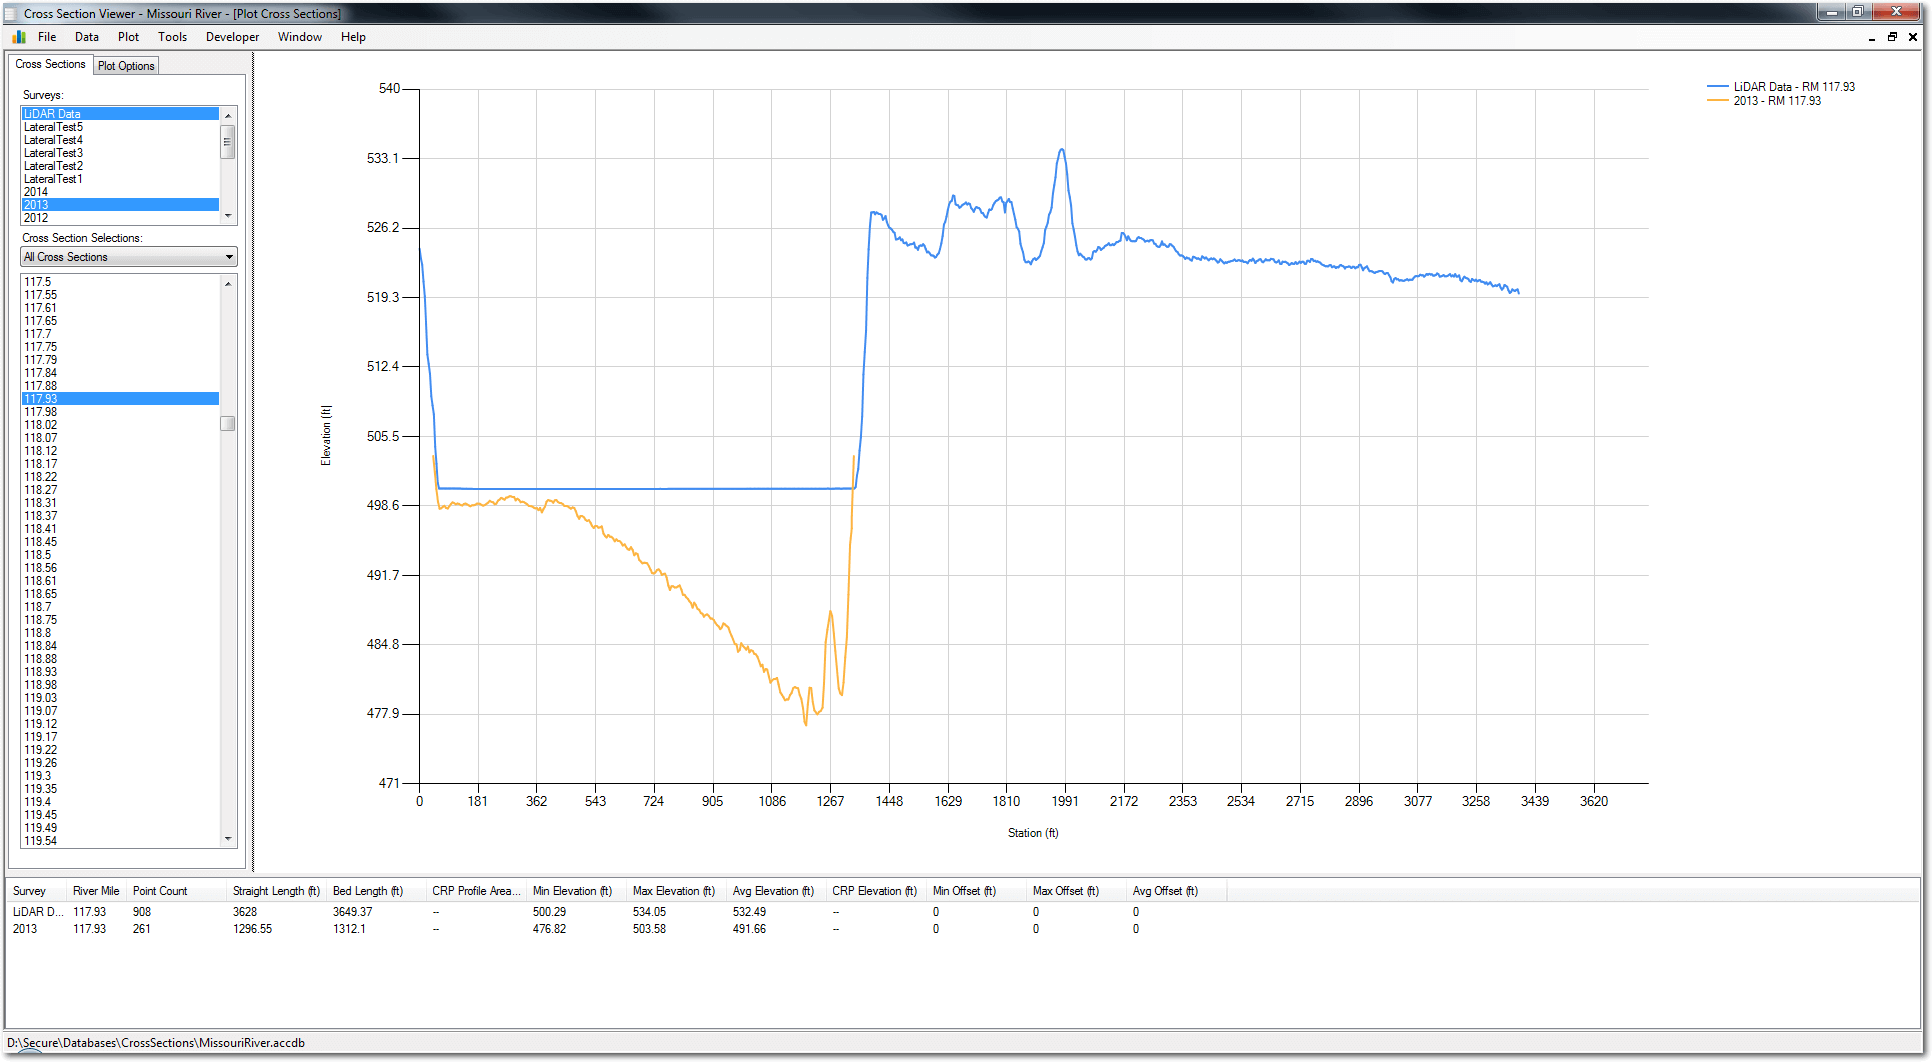
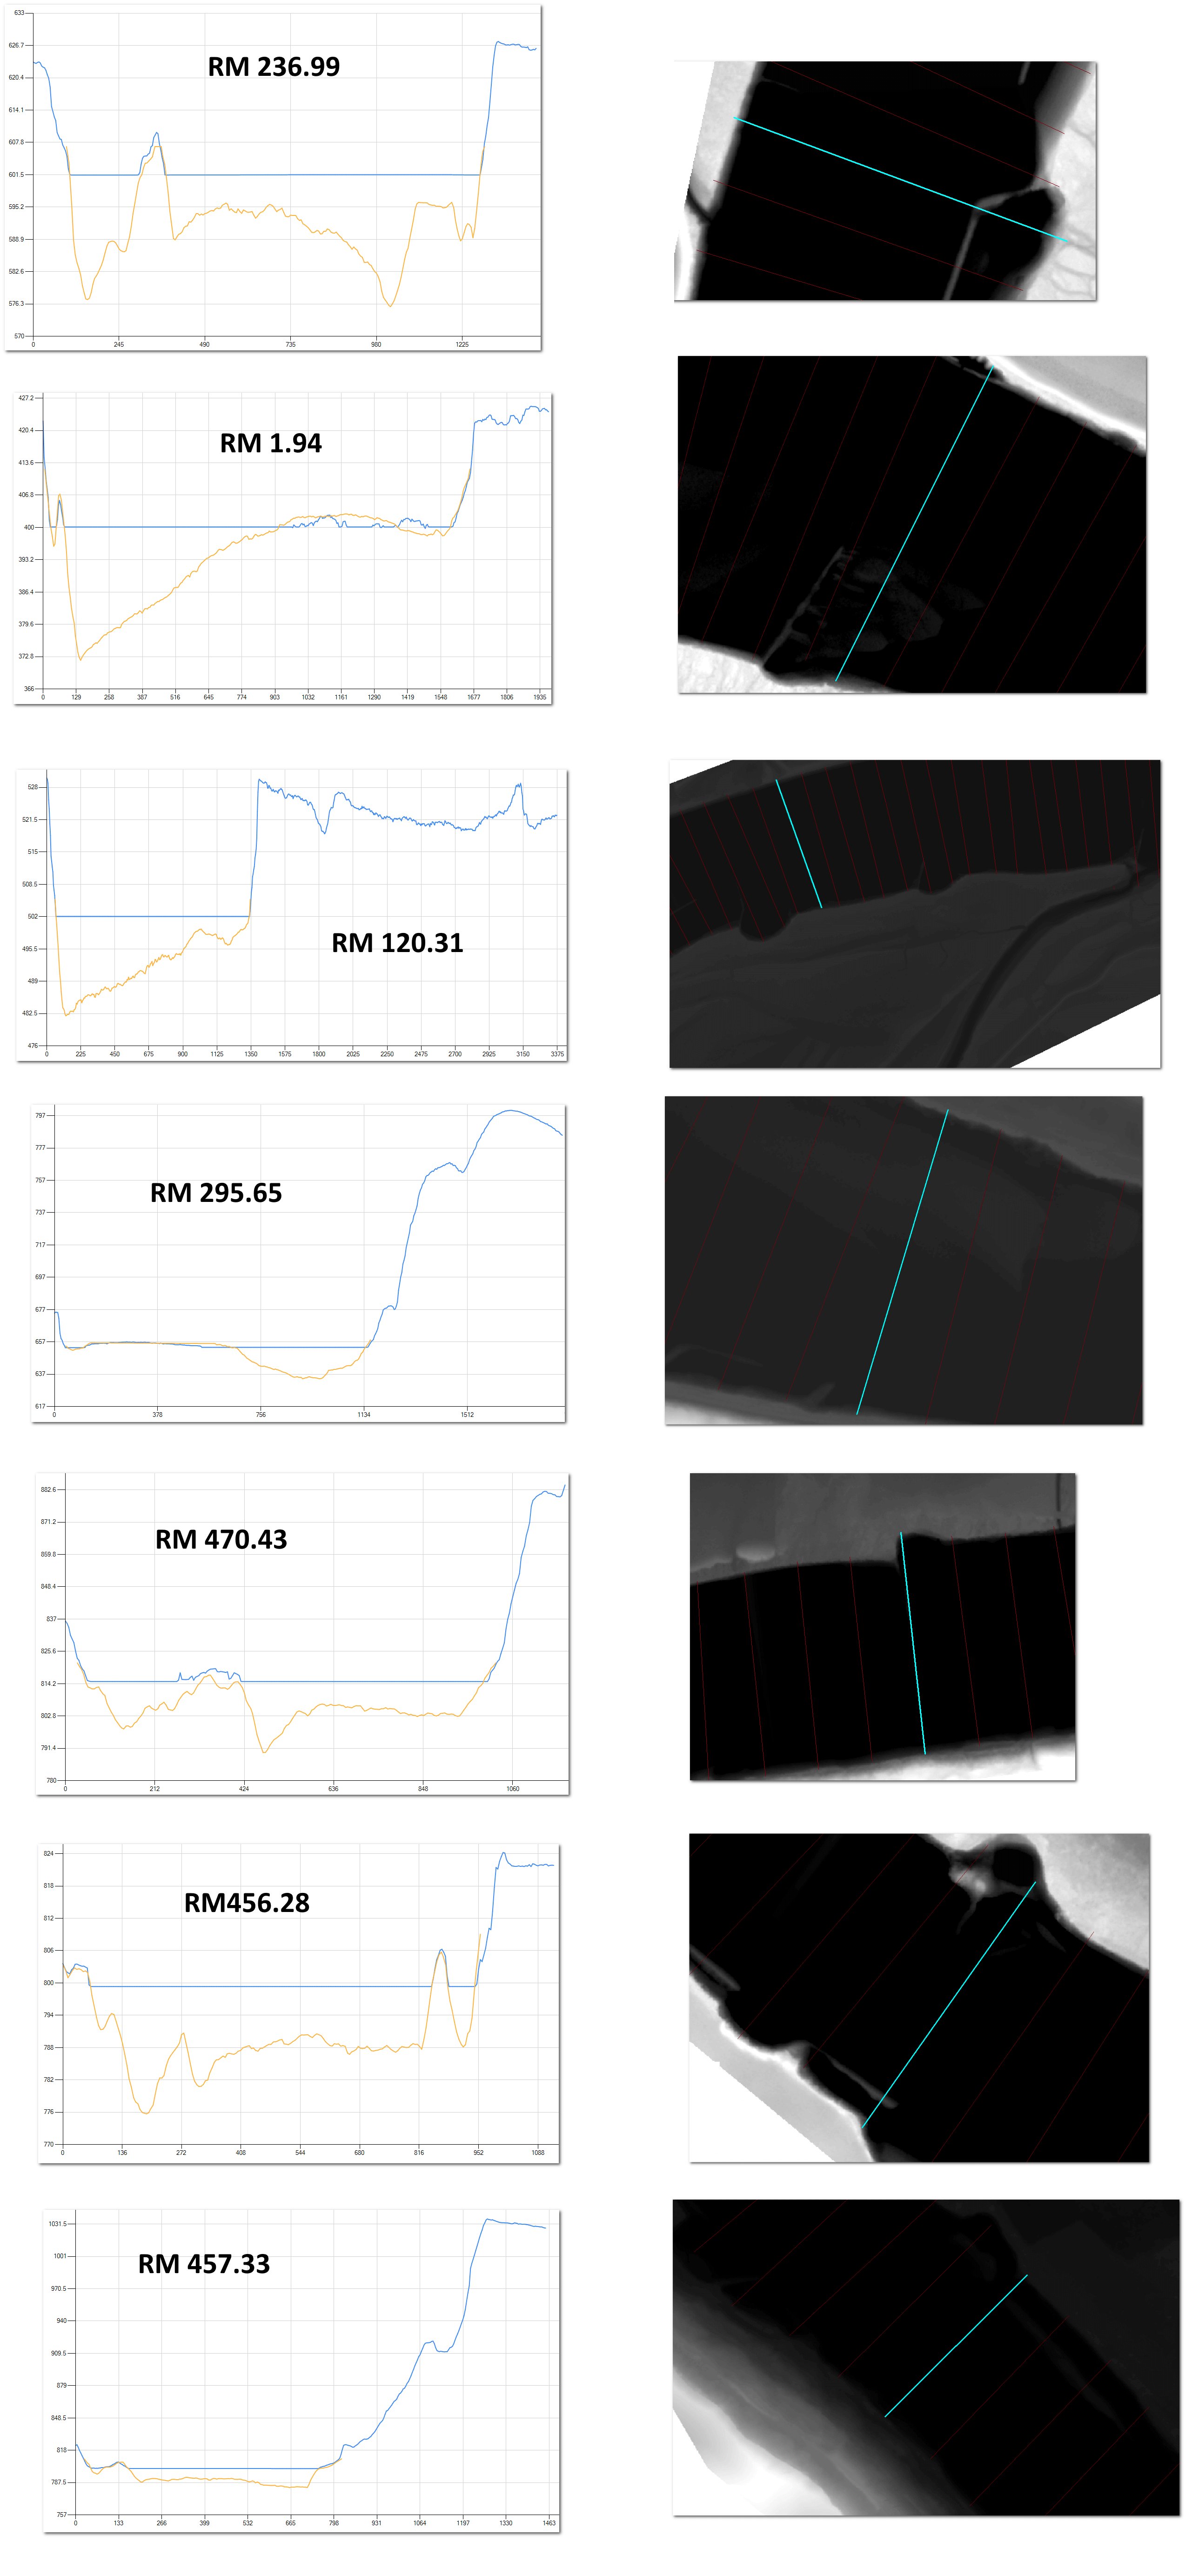


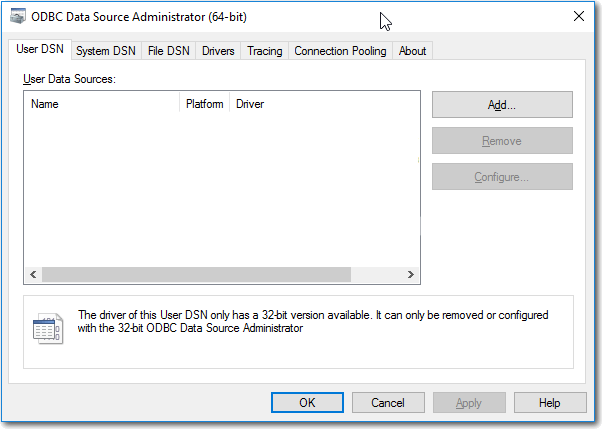
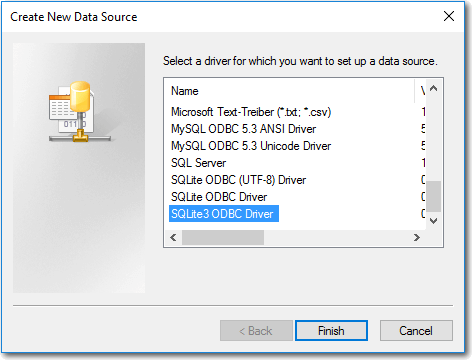
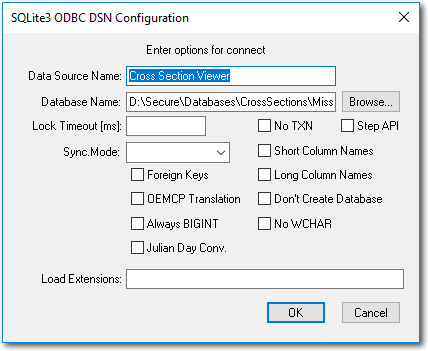
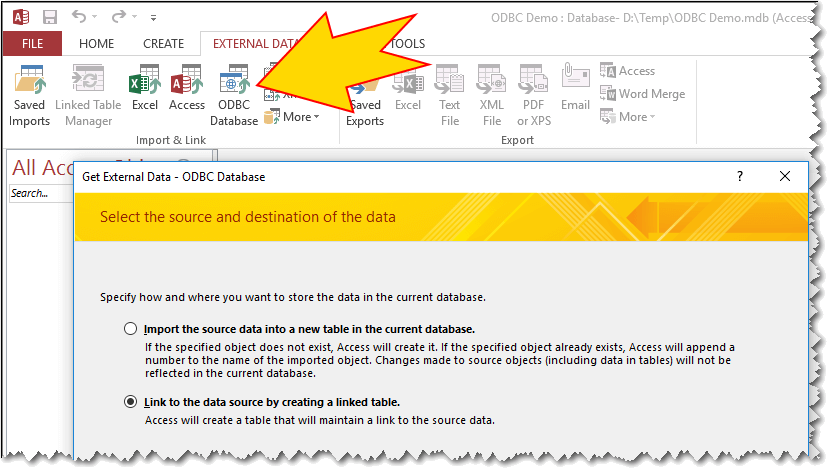
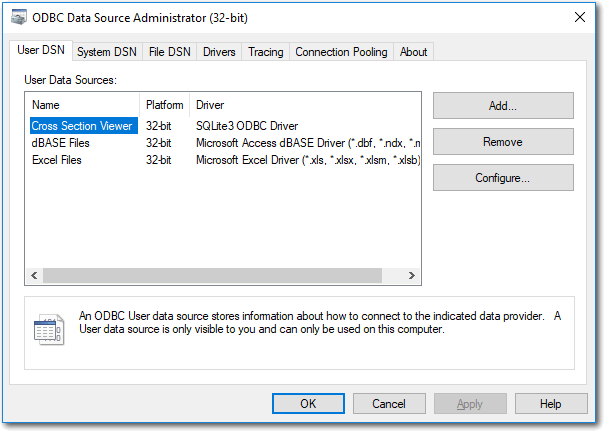
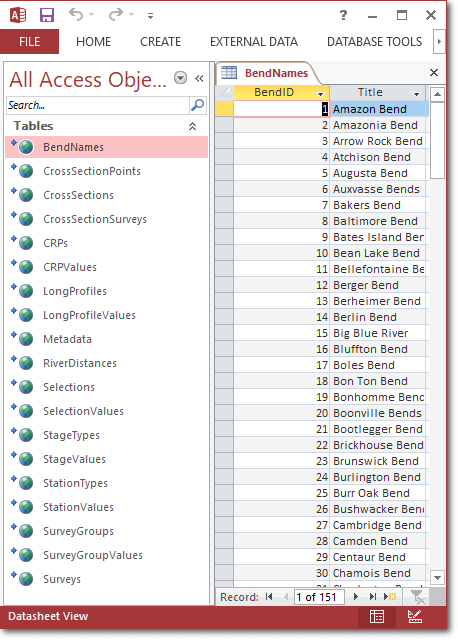
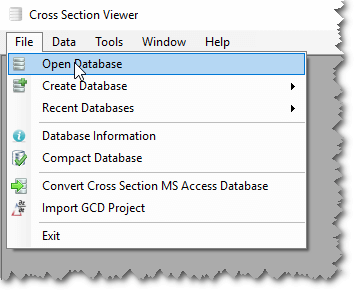
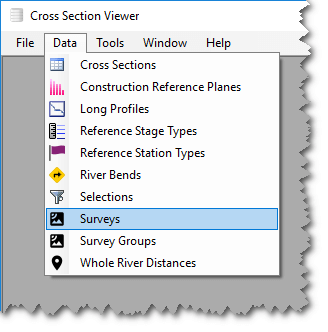
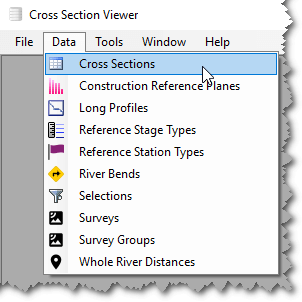
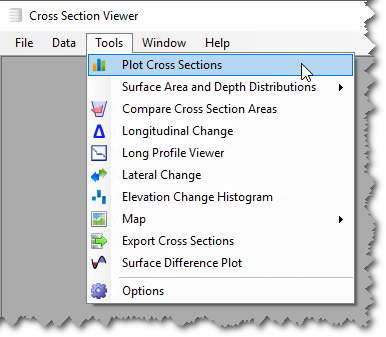
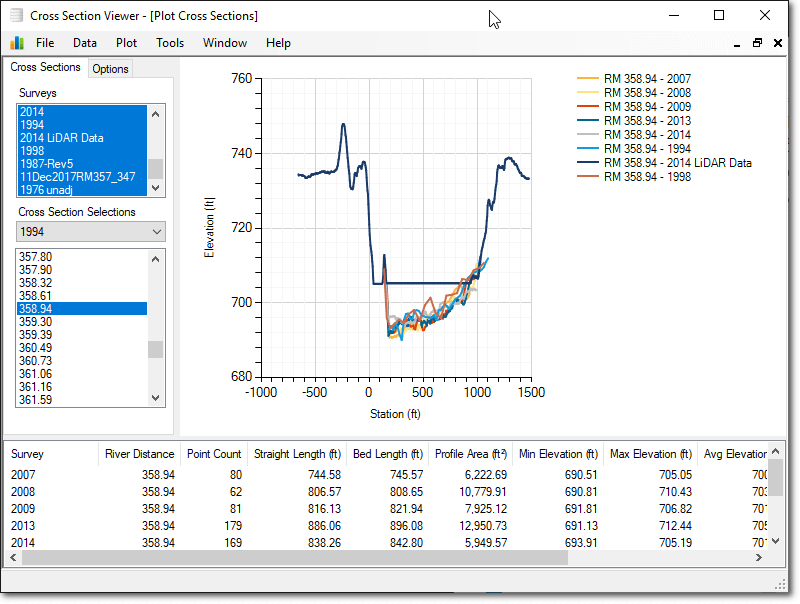
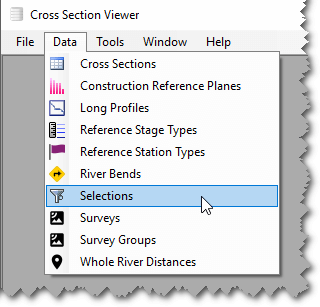
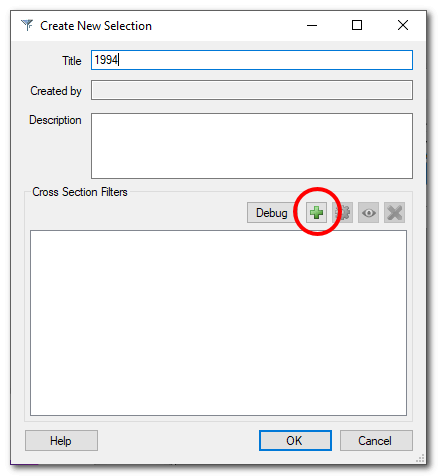
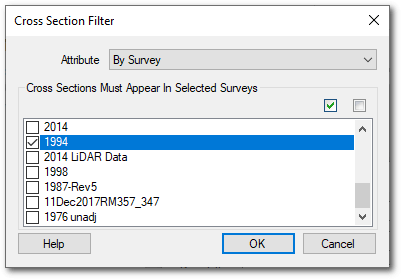
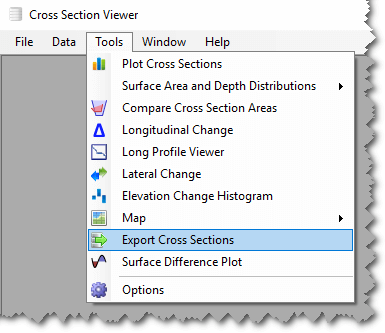
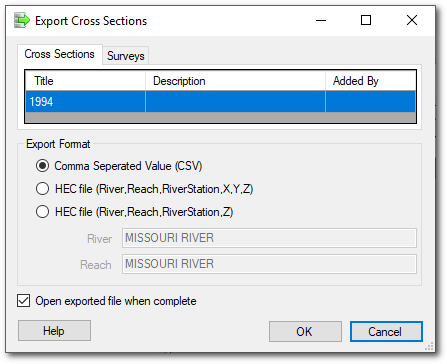
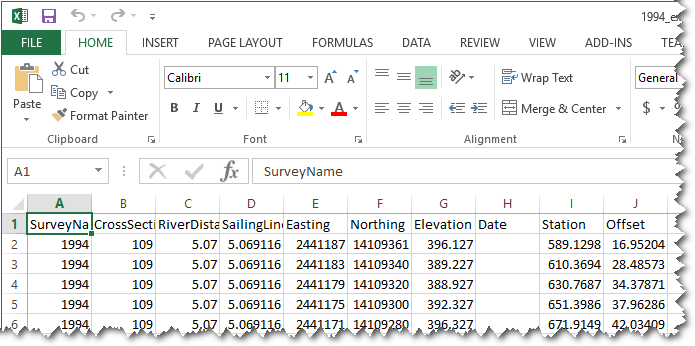
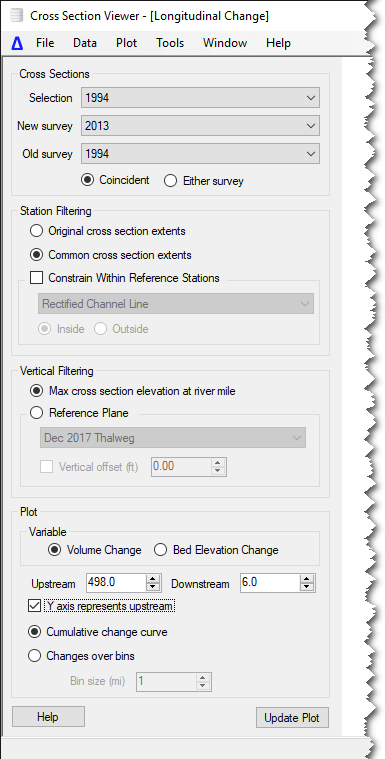
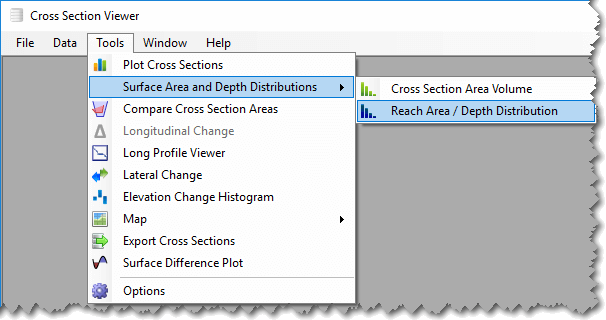
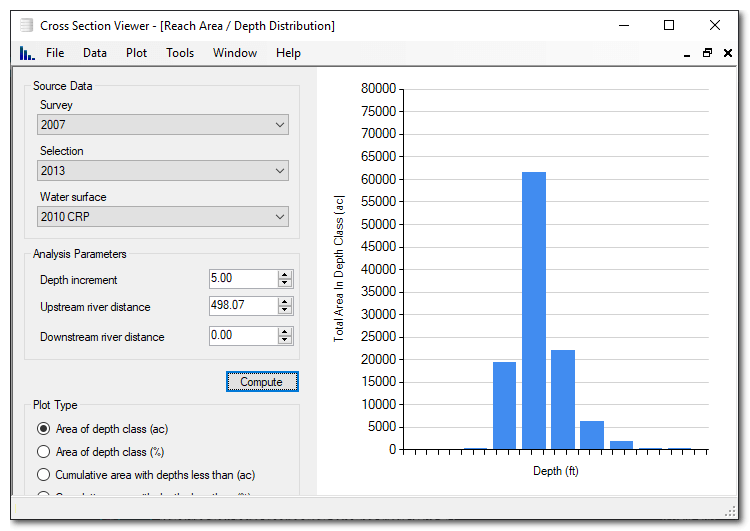
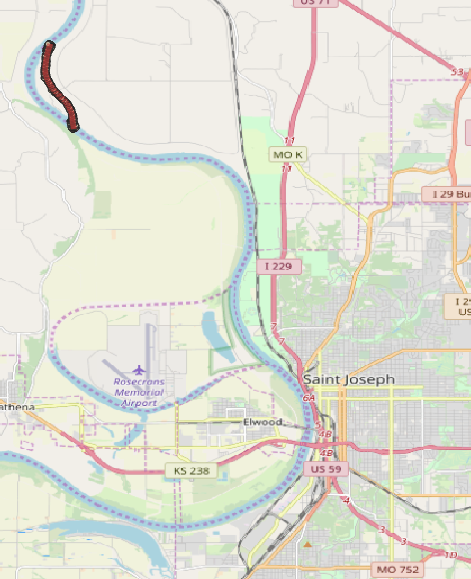
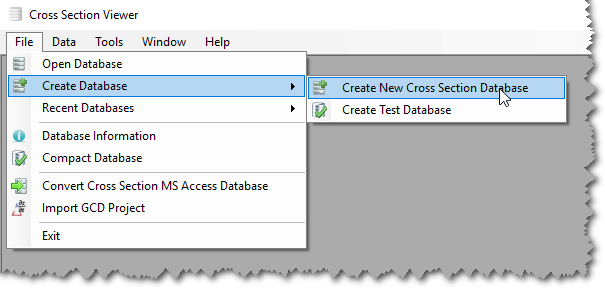
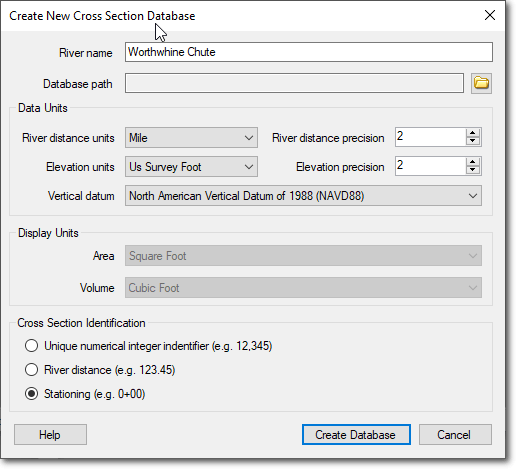
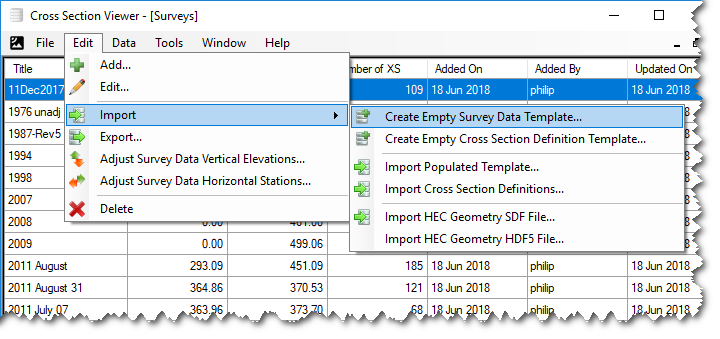
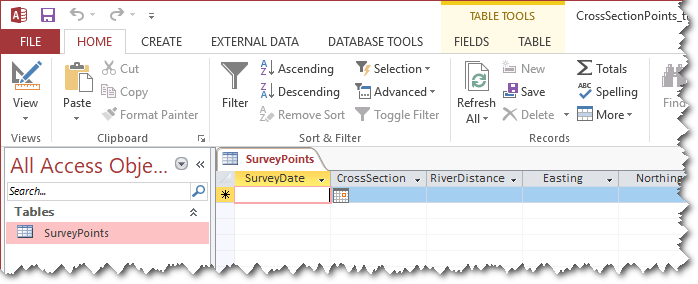
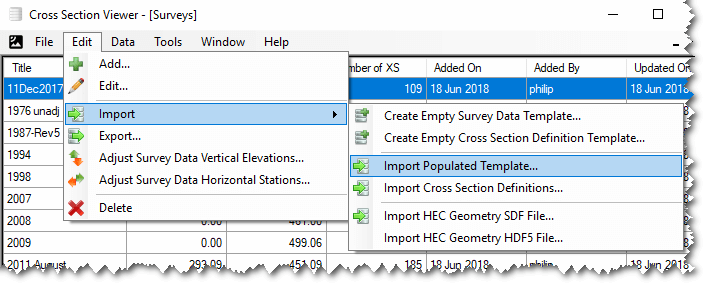


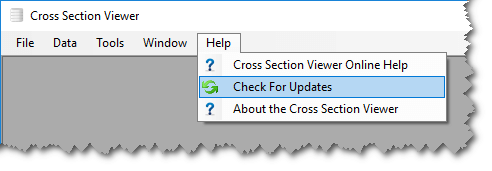
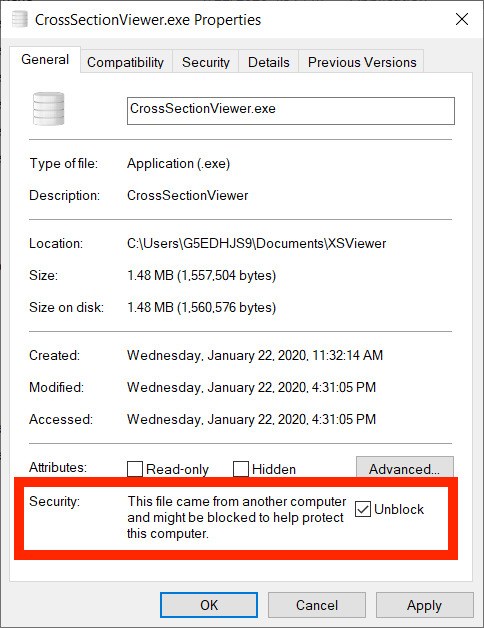 If you still experience problems with Windows Defender blocking the software from running then right click on the exexcutable and check the “Unblock” checkbox then click OK.