Scenario: You want to determine the percentage of total bed degradation from 1994 to 2013 that is directly attributable to commercial sand and gravel extraction (channel mining). Assume 89 million cubic yards of commercial sand and gravel extraction.
Refer to the longitudinal change online help for more information.
Task 1- Open the Cross-section viewer software.
Click the Windows key on your keyboard and then start typing the name of the software “cross section viewer”. The start menu should filter your installed software to just the Cross Section Viewer software. Click the icon or name to launch the Cross Section Viewer.
Task 2- Open the Missouri River Sample database.
Click on File -> Open Database and then browse to the location where you have saved the Missouri River database. Once you click OK the path to the database should appear in the bottom left status bar of the main Cross Section Viewer software window.
Task 3- Create a new selection using only the 1994 cross sections.
(You might already have one.)
3.1 Select Data -> Selections
3.2 Create a new selection by choosing Edit -> New
3.3 Call the selection “1994” then choose the “Plus” button
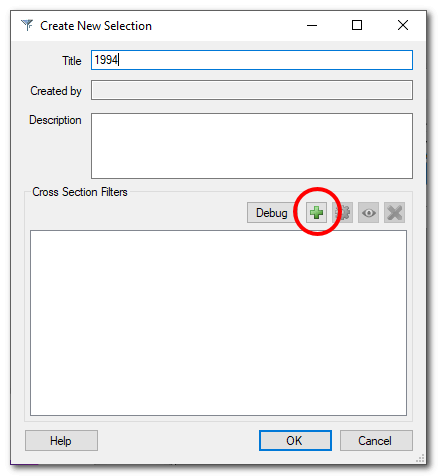
3.4 Select “By Survey” in the “Attribute” drop down. Select 1994. Click OK.
Close the Selections window.
Task 4 - Compute Volume Change from 1994 to 2013
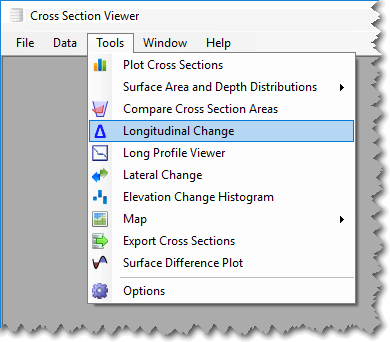
4.1 Select Tools -> Longitudinal Change
4.2 Choose the “1994” selection from the “Selection” drop-down list.
Note: If you use a selection that contains all the cross sections, the software will still only include cross-sections that occur in both surveys. It just takes longer to process.
4.3 Choose the “2013” for the “New” survey and “1994” for the “Old” survey.
4.4 Select “Common cross section extents” (default) for “Station Filtering” and “Max cross section elevation at river mile” (default) for vertical filtering
4.5 Set the “Upstream” to 500 and “Downstream” to 0.
Setup should be as follows:
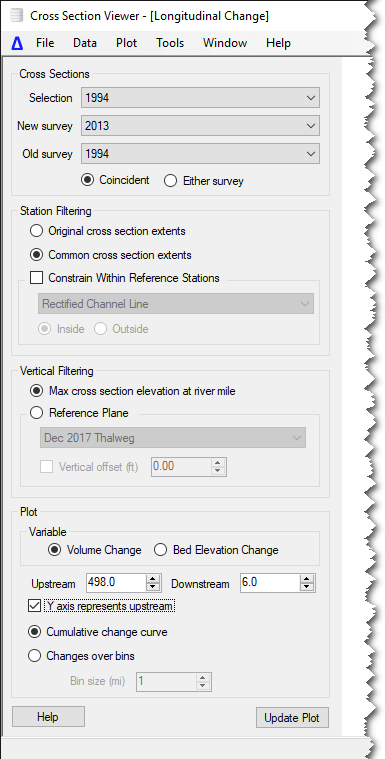
Click “Update Plot”
Approximately how much total volume of bed material degraded from 1994 to 2013 for River Miles 498 to 351.6?
Approximately how much total volume of bed material degraded from 1994 to 2013 for River Miles 498 to 10?
4.6 Export the data used to make the graph by selecting Plot-> Export Data
**4.7 Bring the .txt file you just created into Microsoft Excel.</span>
What is the total volume change between RM 498 and 6?
What is the total volume change between RM 497.46 and 495.94?
There are two ways to do this. Either sum the control volume changes starting with the value with 497.46 in the “upstream” column and ending with 495.94 in the “downstream” column or subtract the downstream cumulative from the upstream cumulative change value, only looking at the “downstream” column. i.e. either sum the italic values or subtract the bold in the example below:
- New Survey: 2013
- Old Survey: 1994
| Downstream river mile | Upstream river mile | Control volume change | Cumulative volume change |
|---|---|---|---|
| 498 | 0 | 0 | 0 |
| 497.84 | 498 | 231 | 231 |
| 497.74 | 497.84 | -317628 | -317397 |
| 497.56 | 497.74 | -703613 | -1021010 |
| 497.46 | 497.56 | -48001 | -1069011 |
| 496.94 | 497.46 | -1193093 | -2262104 |
| 496.8 | 496.94 | -887222 | -3149326 |
| 496.27 | 496.8 | -2429084 | -5578410 |
| 496.03 | 496.27 | -1793332 | -7371742 |
| 495.94 | 496.03 | -587796 | -7959538 |
| 495.66 | 495.94 | -2635084 | -10594622 |
| 495.46 | 495.66 | 94761 | -10499860 |
| 495.37 | 495.46 | -351816 | -10851676 |
| 494.95 | 495.37 | 391648 | -10460029 |
| 494.81 | 494.95 | -970735 | -11430763 |
What is the percentage of total bed change from 1994 to 2013 directly attributable to commercial sand and gravel extraction for the full lower 498 miles?