Cross Section Viewer allows the user to compare how cross sections behave across surveys. This is a visual tool only, and does not perform any quantitative analysis or produce numerical results. The original intent of this feature was to illustrate the cross section filtering and truncation that is used in the longitudinal change and lateral change tools. See the cross section area calculations for more information on the methods used.
This tool simulates adjusting surveyed cross sections on a plot. The adjustments are merely visualizations. This tool does not write or store any information back to the cross section viewer database.
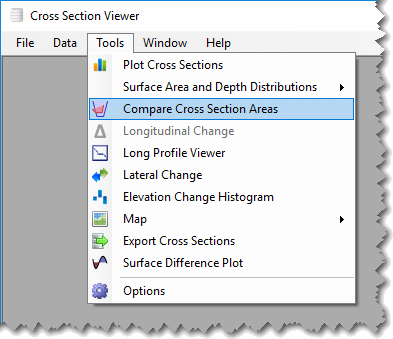
The compare cross section areas tool is launched from the main Tools menu.
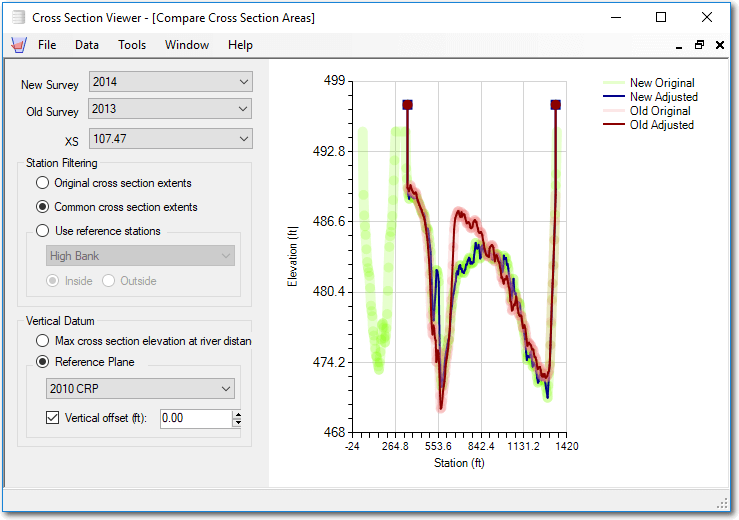
- New Survey - Select one of the existing surveys in the current database.
- Old Survey - Select another of the existing surveys. Technically, the old survey doesn’t have to be chronically occur before the new survey. The terms new and old are merely designations for symbology on the plot.
- Cross Section (XS) - Select the desired cross section. The cross section must occur in both the old and new surveys for the plot to work.
- Station Filtering - the plot filtering manipulates how the new and old cross sections are trimmed horizontally.
- Original Extents - simply plots the new and old cross sections as the data appear in the database.
- Common Extents - trims each cross section laterally to the narrowest common extent. If the longer survey does not possess a surveyed point at the new, desired station then one is interpolated to ensure that both cross sections start and stop at the same station.
- Reference Stations - Trims both surveys to the reference stations for the selected cross section. Note that the list of reference stations available in the dropdown is filtered to just those reference station types that possess two stations (i.e. a left and right station.) e.g. a rectified channel line reference station type will appear, but a sailing line reference station type will not (because it is defined by only one station).
- Vertical Filtering - determines how the two cross sections are filtered vertically.
- Max elevation - The default option simply extends both cross sections up to the maximum elevation of either surveyed cross section. That is, new survey points are added to the ends of the lower cross section such that the both cross sections start and stop at the same elevation (but at their individual, original station distances).
- Reference Plane - Extends or truncates both cross sections to start and end at one of the reference plane stages. Note that the cross sections are capped at the reference plane elevation at anywhere along their length where they pass above the reference plane. * Vertical Offset - The vertical filtering reference plane can be offset by a user-defined amount. A positive value represents an offset above the reference plane, while a negative value represents below the reference plane.
Plot Symbology
The goal of the plot is to show both the new and old cross sections, both before and after the filtering is applied. This essentially produces four cross section lines:
- The original new survey cross section data are represented by a wide, pale green line.
- The adjusted new survey cross section data - after the horizontal and vertical filtering are applied - are represented by a narrow, bold blue line.
- The original old survey cross section data are represented by a wide, pale pink line.
- The adjusted old survey cross section data - after the horizontal and vertical filtering are applied - are represented by a narrow, bold red line.