The Plot Cross Sections tool is the main way to visualize cross section data. Cross sections are displayed in profile view, across the river, perpendicular to flow. Multiple cross sections can be viewed simultaneously and several different types of reference lines can be included in the display.
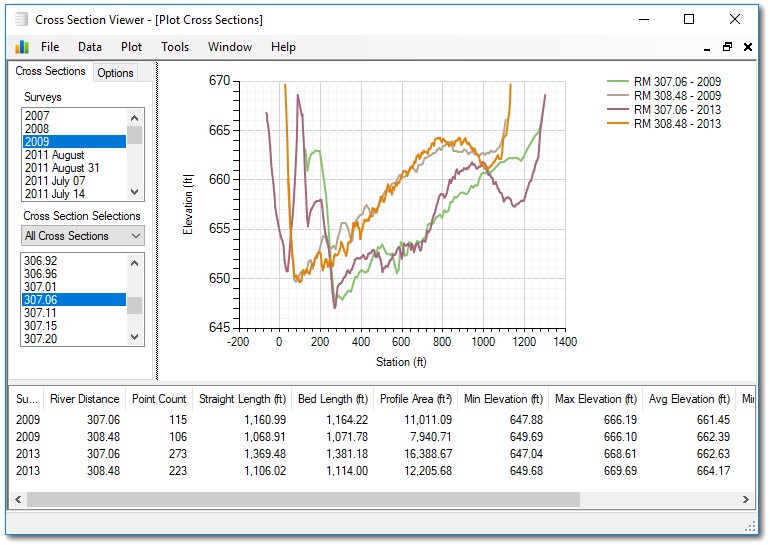
The window is divided into three panes: The left pane contains the controls to select which cross sections are included in the view. The bottom pane contains summary metrics for each cross section currently being displayed. And the right pane contains the cross section plots themselves.
Cross Section Controls
Start by selecting one or more surveys for which you want to display. You can select multiple surveys by clicking the first desired item in the list and then holding down shift to click a second item. All surveys between the two items clicked will be selected. A discontinuous set of surveys can be selected by holding down the control key (CTRL) key while you click.
Pick the selection that contains the cross Selection that you want to view in the plot. If you need to create a new selection, you need to close the cross section plot tool before you can use the new selection.
Pick one or more cross sections from the bottom list using the same shift or control key technique described above. Cross section profiles will start to appear in the right pane once you have at least one survey and cross section selected.
Note that this bottom cross section list only contains the cross sections that occur within the currently selected survey(s) and selection above. If you are looking for a particular cross section and it doesn’t appear it is probably that it wasn’t surveyed in the currently selected survey(s) and/or doesn’t exist in the selection. visit the surveys and Selection tool to investigate whether this is true.
Cross Section Metrics
The bottom pane shows summary metrics for the cross sections that are currently displayed in the main plot area.
- Survey - name of the survey to which the cross section belongs.
- River distance - longitudinal position of the cross section along the river. River distance zero is downstream.
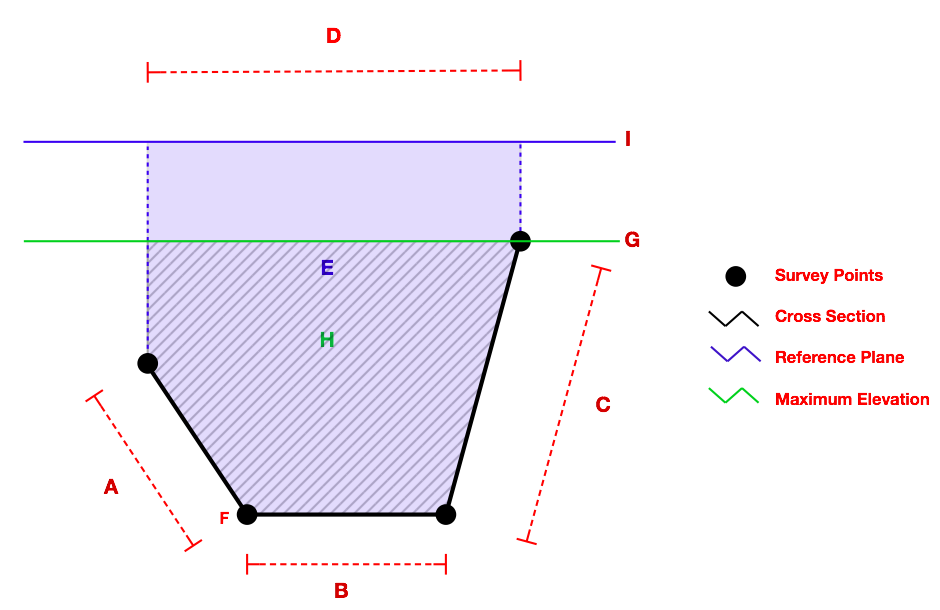
- Point count - total number of surveyed points along the cross section. i.e. the count of black dots in the figure above.
- Straight length (
D) - planimetric, 2D euclidean distance between the first and last surveyed point. - Bed Length (
A + B + C) - sum of the lengths between each survey point along the cross section. - CRP profile area (
E) - the profile area of the cross section after it is either extended up to, or truncated at, the construction reference plane. See the technical reference. - Min Elevation (
F) - the absolute, vertical elevation of the lowest surveyed point. - Max Elevation (
G) - the absolute, vertical elevation of the highest surveyed point. - Average Elevation (
G - ((H/D)/2)) - the average elevation of all surveyed points. - CRP Elevation (
I) - the absolute, vertical elevation of the newest CRP for this cross section. - Min Offset - the smallest offset of any survey point along the cross section.
- Max Offset - the largest offset of any survey point along the cross section.
- Average Offset - the average of all offsets for surveyed points along the cross section.
Offsets
Survey vessels commonly attempt to follow monumented cross sections (using GPS and/or navigation software), but the actual path that the vessel follows differs from the intended, monumented cross section. In these situations, an offset can be recorded that captures the planimetric, 2D, Euclidean distance of the point that was actually surveyed from the position on the monumented cross section that it represents.
The Plot Options tab (see below) enables the user to filter out survey points that possess an offset greater than a specified tolerance. This can be useful if several surveyed points possess excessive offsets.
Note that this main cross section plot tool is the only tool in the cross section viewer software that uses offsets and performs this filtering. All other tools use all surveyed points for each cross section whenever performing any kind of analysis.
Plot Export
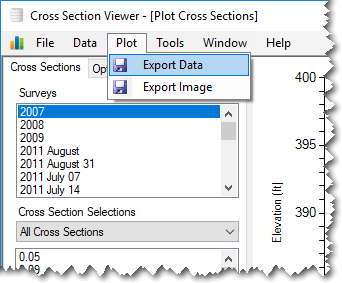
The currently displayed plot image as well as the underlying data can be exported at any time. When exporting the data, the stations and elevations for all currently displayed cross sections are written to a comma separate plain text ASCII file. Th plot image can be exported as Bitmap, GIF, JPEG, PNG, TIFF or WMF format.
Plot Options
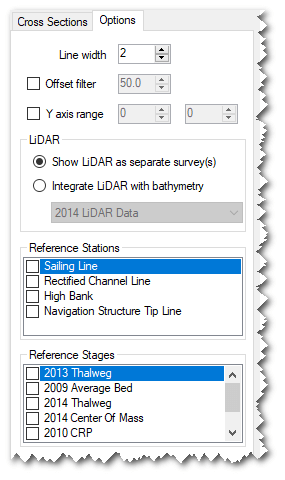
The plot options tab contains several ways of controlling the cross section plot.
- Y Axis - You can adjust the minimum and maximum values of the vertical axis on the main plot. Values are in the same units as the cross section elevation data.
- Offset filter - If the cross section data possess offset values, this control can be used to exclude survey points that possess an offset greater than the value shown (see graphic and explanation above).
- LiDAR Integration - See the Lidar Section below
- Line width - controls the thickness of the line used to draw all cross section profiles. Units are in screen display pixels.
- Reference stations - adds vertical lines to the plot at the relevant distances along the cross sections. Reference stations are managed using the main Data menu.
- Reference stages - adds horizontal lines to the plot at the relevant elevations. The items available are a combination of the construction reference planes and Reference Stages stored in the current database. Both types can be managed using the main Data menu.
LiDAR Integration
The plot can combine one set of cross section data that pertain to inside the river channel with another dataset that represents the out-of-channel surface. This is useful when you have boat-based bathymetric surveys in addition to LiDAR data for the surrounding floodplain. Typically the bathymetric data will extend almost to the edge of the wetted channel (or as shallow as the boat could navigate) whereas the nearinfrared LiDAR is absorbed by water and will not extend much beyond the dry surface. Providing these two datasets are available for the same monumented cross sections, the software is capable of integrating the two surveys into a single plot line. Note that the underlying data are not altered. They are merely combined for display purposes.
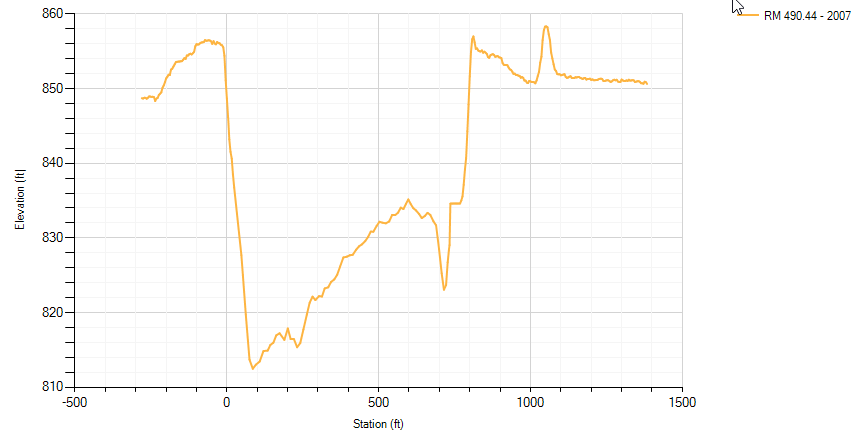
The following image shows two surveys for the same cross section. The red line represents a single bathymetric cross section captured by boat. It extends to either bank as far as the boat was able to navigate. The blue line represents elevations extracted from a LiDAR digital elevation model (DEM). Notice the flat line in the middle of the cross section where there is no LiDAR response because water absorbs near infrared radiation.
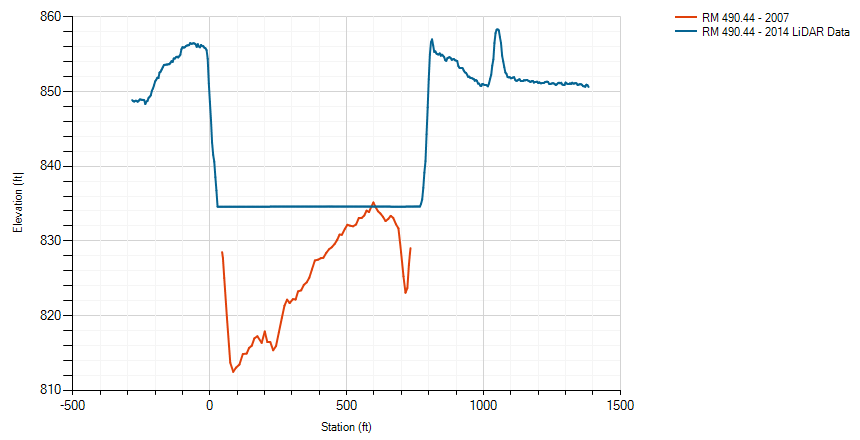
Turning on the LiDAR integration feature merges these two lines into a single cross section line that uses the bathymetry in the channel and the LiDAR data on the land. Note that while you can store as many LiDAR surveys as needed in a cross section viewer database, only one can be used at a time for display purposes.
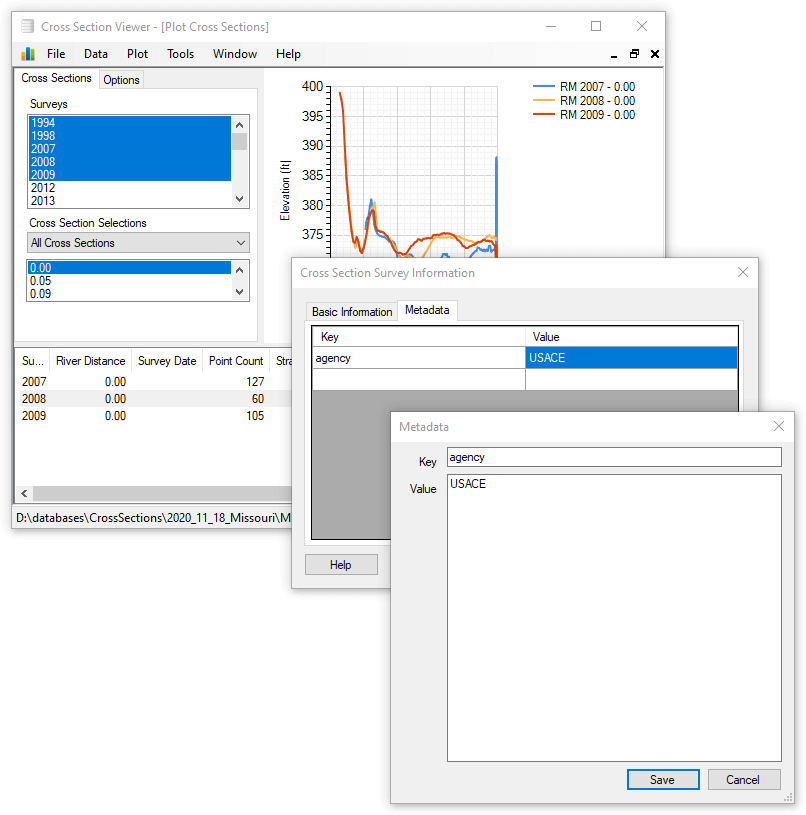
Editing Survey Information
You can edit the information associated with an individual cross section within a survey. Right click on the cross section in the table at the bottom of the main plot window, or choose the “edit cross section survey” item from the Plot menu.
You can enter a description or choose whether or not to provide a survey date. You can also enter key-value metadata items. Once you have entered a key value entry, you can double click it to get a pop-up form that is more convenient for entering long text.