The elevation change histogram operates on two surveys that represent different points in time. The analysis looks at each cross section that occurs in both surveys and calculates the average elevation of stations in each survey. These average elevations are calculated by dividing the profile area of each cross section by its top width (not simply by dividing the distance between the first and last surveyed point by the net distance, which would lead to incorrect bias in the result when irregular point spacing occurs). The analysis then moves upstream from a user specified river mile distance and calculates the average elevation change at cross sections and accumulates these changes into user-defined bins.
Methodology
The illustration below represents two surveys X and Y collected on the same river channel at different points in time. In some cases the same cross sections were collected during both survey X and Y (C, D, E and G) while each survey also possesses cross sections that were not collected during the other survey; Survey X also collected at B and F, while survey Y collected data at A and F.
First, it should be noted that the elevation change analysis is only possible within the portion of the river channel where both surveys possess data. That is from cross section B to G. Outside of this range it’s not possible to calculate the elevation change in one or other of the surveys.
The process begins by identifying all the locations where both surveys are collected (B, C, D, E and G). The surveyed transects at these locations are trimmed to the common extent so that a comparison can be made. They are also capped at the maximum elevation of their survey. The average bed change is calculated by obtaining the averge bed elevation of each survey and then subtracting the old from the new survey.
The results are then binned by weighting the contribution of each transect within the river distance bins. The process starts at the specified downstream river distance and moves upstream in increments of the specified bin size. Within each bin each transect is assigned half the distance to the next contributing transect. So in the example below, assuming the user has requested the analysis be performed from river distance 4 to 14 in increments of 2, the following contributions would apply:
The final value for each bin is the weighted average of all bed elevation changes within the corresponding river distance bin.
Inputs
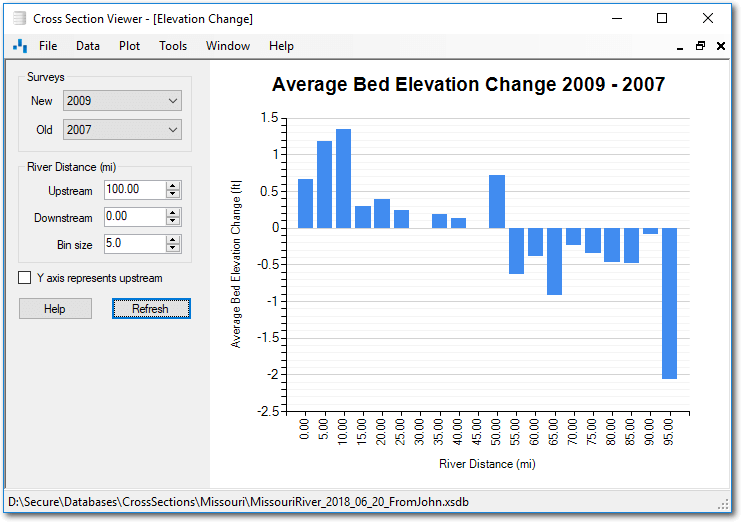
- Upstream River Distance - The most upstream point at which the change is measured. If no cross section is present at this river distance in one or both of the surveys then elevation change is interpolated at this distance using adjacent cross sections.
- Downstream River Distance - - The most downstream point at which the change is measured. If no cross section is present at this river distance in one or both of the surveys then elevation change is interpolated at this distance using adjacent cross sections.
- Bin Size - the length of the bins used to report the analysis. The units are those specified as the “river distance units” when the database was created.
- New Survey - the newer of the two surveys. Positive change is reported when the average bed measured in this survey is higher than that of the old survey.
- Old Survey - the older of the two surveys. Negative change is reported when the average bed measured in this survey is higher than that of the new survey.
- Reverse Y Axis - controls whether the the axis increases from left to right or is displayed in the reverse direction. This control is simply controls the display and does not affect the values displayed.