The Cross Section Viewer contains two tools to visualize areas and depths. The cross section area and depth tool works on a single location along the river, while the reach tool operates on a selection of cross sections, summarizing for the desired reach.
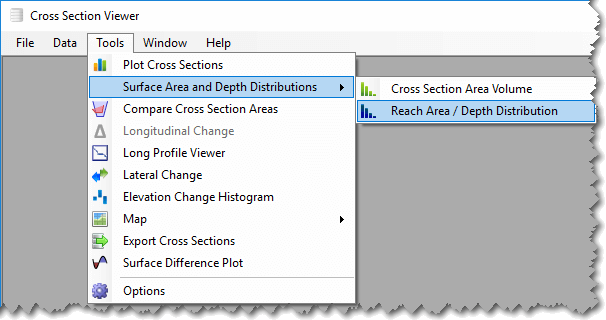
Planimetric Cross Section Areas
The analysis works on a single cross section at a time. Multiple cross sections for multiple surveys can be visualized at once, but the actual calculations are always performed for a single cross section. In other words, the results are for a single point in time and not a temporal analysis. The remainder of this explanation is therefore focused on a single cross section.
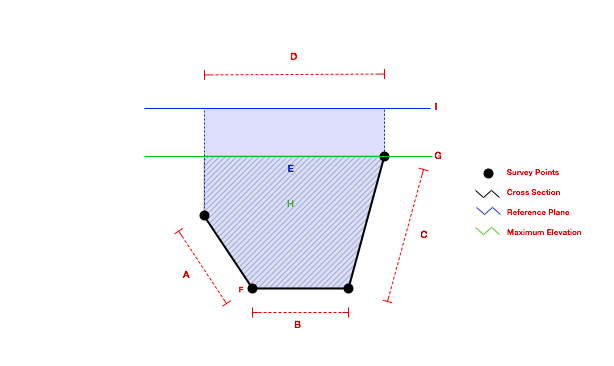
The analysis requires the user to select a reference plane elevation. This is the vertical upper limit of the analysis and represents depth zero (0). The analysis continues in increments of the user-defined depth bin size. In each depth bin, the profile area of the cross section is calculated between the upper and lower elevations of the bin. Parts of the cross section that extend above the upper depth bin boundary are not considered. And parts that extend below the lower boundary are also not considered. This process is repeated downwards from the reference plane until the upper depth bin elevation falls below the minimum elevation of the cross section. The profile area for each depth bin is accumulated for each bin and reported in the plot.
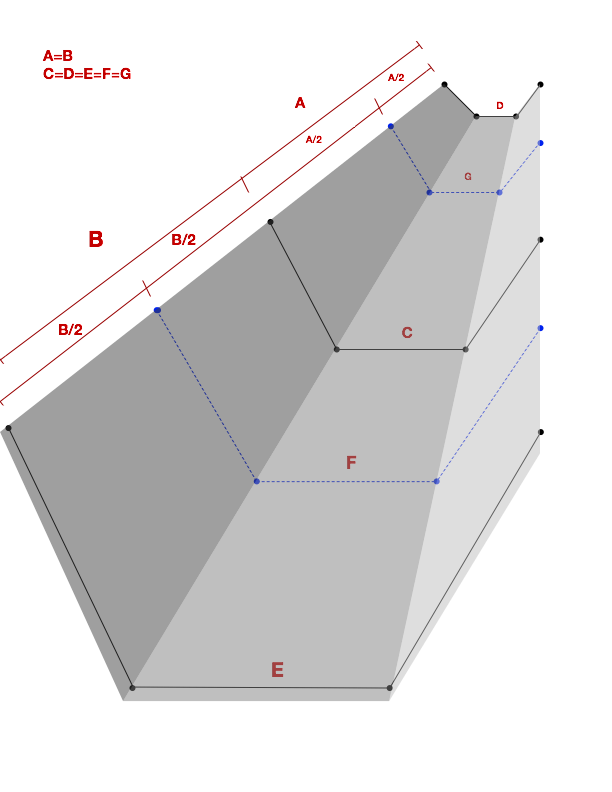
The areas for each bin are converted to volumes by multipling the profile area in each bin by half the distance to the next cross section in both the upstream and downstream directions. So in the diagram below, the area for a particular depth bin at cross section C is multiplied by half the distance to cross section D and half the distance to cross section F.
Using The Tool
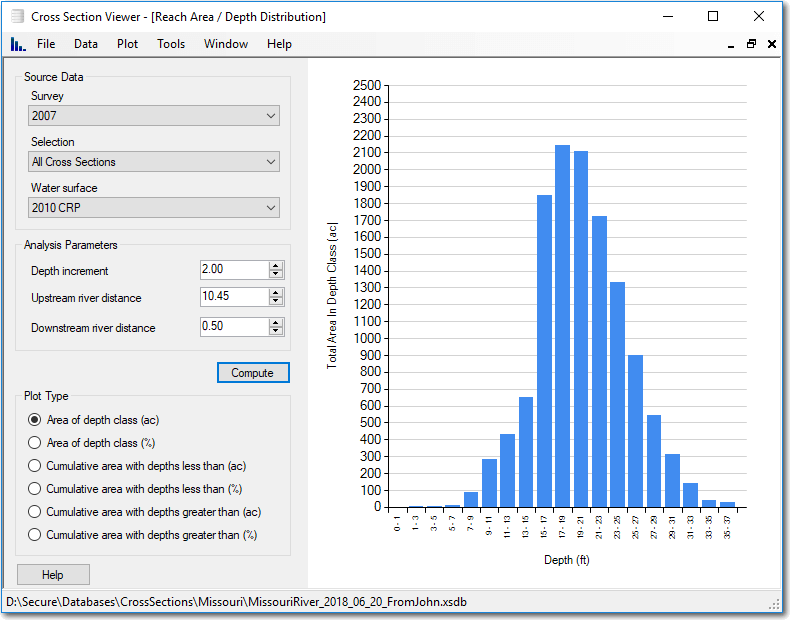
- Reference Plane - select a single reference plane that will become the upper elevation of the analysis. In other words, depth zero. Note that if you select multiple surveys, the same reference plane is used for all surveys. But if you select multiple cross sections, a separate reference plane elevation will be interpolated for each cross section river mile.
- Depth Bin Size - the vertical bin height for the analysis. This is in the same units as the survey data in the Cross Section Viewer database.
- Display Type - choose between area and volume (see above for explanation).
- Incremental or Cumulative - controls whether to display the raw area/volume in each depth bin or accumulate the values, starting at the reference plane (depth 0) moving downward through the channel.
- Selection - Pick the selection that possesses the cross sections for which you want to perform the analysis.
- Cross Sections - This list displays just those cross sections that belong to the hightlighted selection above. Select a single cross sections, or hold down the
SHIFTorCTRLkeys to make either a contiguous or noncontiguous selection respectively.
Export
Once the plot has been created, the underlying data, or the plot image itself, can be exported from the Plot menu. Plot data are exported to plain text, comma separated value (CSV) file, while plot images are exported to portable network graphic (PNG) files.
Calculation Walkthrough
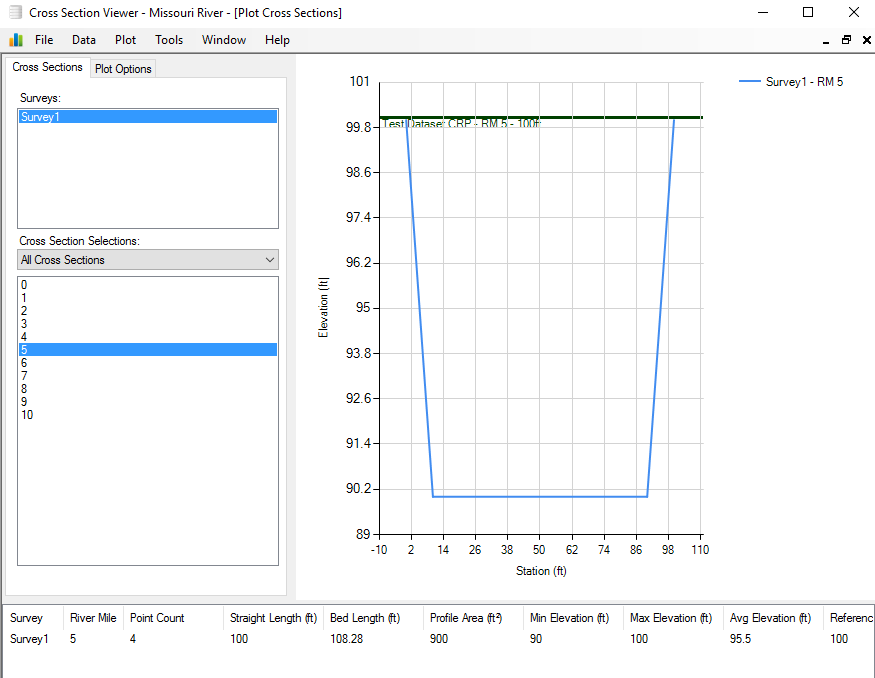
The test database generator was used to generate a hypothetical river with 10 idealized cross sections each separated by 1 mile. The river travels in a straight line with surface width of 100 ft that is reduced to 80 ft at the river bed. The angle of descent has been defined as 45º.
Length (L): in this example, the length between all cross sections has been defined as 1 mile, or 5280 ft. This value is constant. Therefore, the distance between the cross section of interest, and the nearest upstream cross section is 5280 ft. Similarly, the distance between the cross section of interest, and the nearest downstream cross section is 5280 ft. The distance between the two halfway points is therefore also 5280 ft. Thus, L = 5280.
Width (W): in this example, we will begin by considering the width of cross section of interest at depth (D) of 0 (i.e. the surface). At D=0, W has previously been defined as 100 ft. The geometry of the cross section can be separated into a rectangle, of M width and two right-angle triangles of S widths. Therefore, W at D=0 is 10 + 80 + 10 = 100 ft. The maximum depth has been defined as 10 ft. Therefore, W at D=10 is 80 ft (or M).
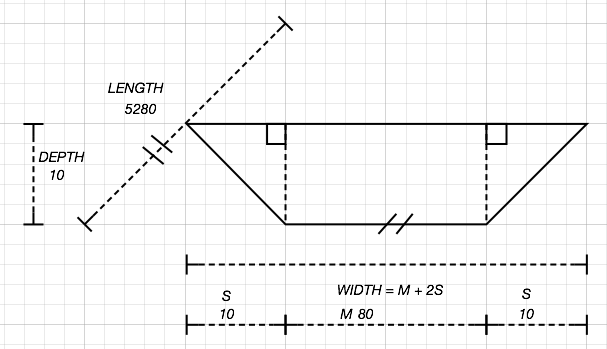
The width will change with depth. In this example, the trapezoid is symmetrical and the angle of descent has been defined at 45° (or pi/4 radians). The triangles can thus be represented as below where adjacent and opposite are equivalent to S and D respectively.

S (adjacent) changes with D (opposite) according to trigonometric principles:
S = (10-D) × tan(45º)
Within Cross Section Viewer, the depth at which the areas are calculated depends on the bin size. When the bin size is 2, the depth of the river is divided, in this example, into 5 discrete sections (0-2, 2-4, 4-6, 6-8, 8-10). The area is calculated at the halfway point between two depths – i.e. 1, 3, 5, 7, 9. Therefore, with a bin size of 2 using this idealized cross section, areas will be calculated at 1,3,5,7,9.
Sample planimetric cross section calculation at D = 3 (the second bin, when bin size = 2). First, calculate the value of S at D = 3
S = (10-D) × tan(45º)
S = (10-3) x 1
S = 7
Next, calculate the value of W given S = 7 (remember, M is constant)
W = 2 x S + M
W = 2 x 7 + 80
W = 94
Finally, calculate the area.
A = L x W
A = 5280 x 94
A = 496,320.00 ft^2
Therefore, planimetric area of cross section at depth of 3 ft = 496,320.00 ft2
To calculate volume, simply multiply the area by the height as defined by the bin size (note, not the depth). In this case, with a bin size of 2 feet, the height is 2. If the bin size were 3, the height would be 3 and so on.
V = L x W x H
V = A x W
**V = 496,320.00 x 2
V=992,640,000.00 ft^3
Therefore, the planimetric volume of cross section at depth of 3 ft = 992,640,000.00 ft3
The results:
