North Arrow Research developed a separate, dedicated piece of software to perform the extraction of elevations from LiDAR generated digital elevation models (DEMs). The goal of the tool is to move along cross section lines at a specified interval and extract the elevation value from a DEM raster. The tool is written in such a way that multiple cross sections can be specified in a single ShapeFile, and multiple rasters can be specified in separate GeoTIFF or IMG raster files.
Software Availability
This Elevation Extractor software is available upon request from North Arrow Research by contacting info@northarrowresearch.com.
Prerequisites
The elevation extractor software requires the following software to be installed before it can be used:
- Windows XP or newer.
- Microsoft .Net Framework 4 Client Profile.
- ArcGIS Desktop 10.1 (cannot be any other version of ArcGIS).
- 10Mb free disk space for the software, plus enough space to store large output data files.
Inputs
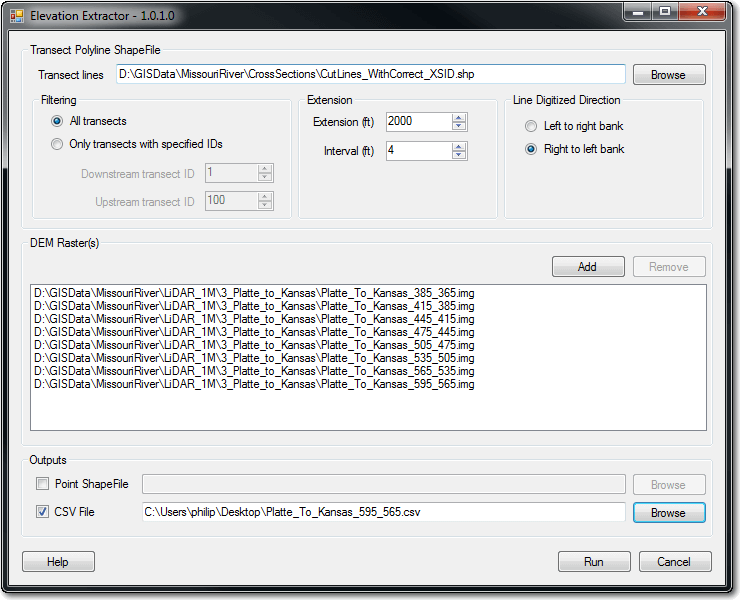
- Double click the
ElevationExtractor.exefile to launch the software. - Click the Browse button to navigate to a ShapeFile that contains the cross section polylines. Each polyline should be a separate, single part feature. The ShapeFile must possess an integer column attribute called
XSIDthat contains the same cross section IDs used in the Cross Section Viewer database where you ultimately want to use the elevation data. If you don’t intend to use the extracted elevations in the Cross Section Viewer then you need to create this field and populate it with arbitrary integers anyway. - Transect Filtering - Select whether you want to process all transects or just a subset specified by an upstream or downstream ID.
- Extension - The extension is an optional distance beyond either end of each cross section polyline that will be sampled. Typically the extension is used to take cross section lines that terminate at the channel margin and elongate them by the specified extension out onto the floodplain.
- Interval - The distance between sample points along the extended cross section lines where elevations will be extracted from the DEM rasters. The interval is applied from the start/from point of the line geometry for each line.
- Line Digitization - This affects whether the lines in the ShapeFile are digitized from left to right bank or reversed. This is useful if the lines were digitized backward. It can be hard to tell which direction was used and it might be necessary to view the lines in ArcMap using an arrowhead symbology to determine the direction used.
- DEM Rasters - Use the
AddandRemovebuttons to incorporate more or less raster files into the process. At least one raster must be specified. Note that the rasters must use the same map projection as the cross section ShapeFile. And if you specify transects within a specific ID range, the cross sections should obviously overlap the particular rasters specified in the tool.
Outputs
You can choose whether to output the extracted elevations as a ShapeFile, comma separated value (CSV) flat text file or both. The former is useful for visualising the extracted locations and elevations as verification for how the tool works. The latter is the most effective source for importing the elevations into the Cross Section Viewer Software.
Importing Elevations Into the Cross Section Viewer Database
The following instructions describe the workflow for getting the extracted elevations from CSV output files and into a copy of the Cross Section Viewer database. The database must already have all the cross sections defined using the same cross section IDs that were present in the cross section ShapeFile used during the elevation extraction process described above.
- Backup the relevant Cross Section Viewer database. This process will alter the data in the database!
- Open the Cross Section Viewer database in Microsoft Access.
- Switch to the
External Dataribbon toolbar. - Click the
Text Filebutton to start the process of importing the CSVs. - Browse to the CSV file in question.
- The first time that you run the tool you should choose the create new table option and call the new table
ExtractedElevations. Subsequent executions of this process should append the contents of the CSV file to the sameExtractedElevations, thereby accumulating all the LiDAR elevations into a simple temporary table.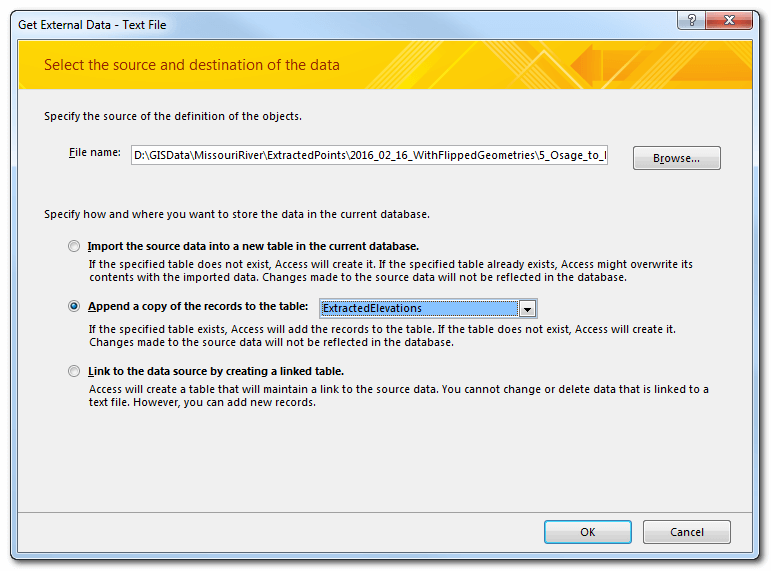
- Click
Next. - Choose the
Commadilimeter. The columns identified in the CSV file should be displayed.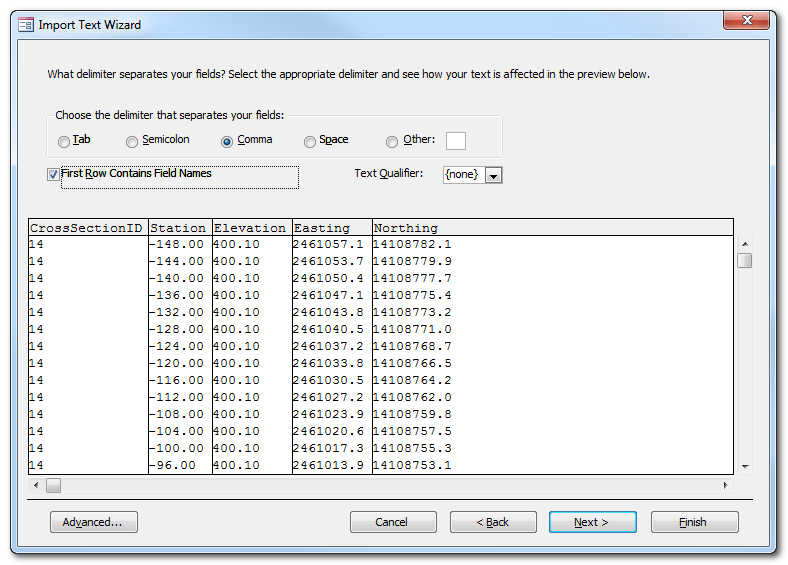
- Click
Nextagain until the data import process is complete. - Open the
ExtractedElevationstable and review the data. It can be useful to sort, count and filter the data using the built-in Microsoft Access features to ensure that all the desired records are present.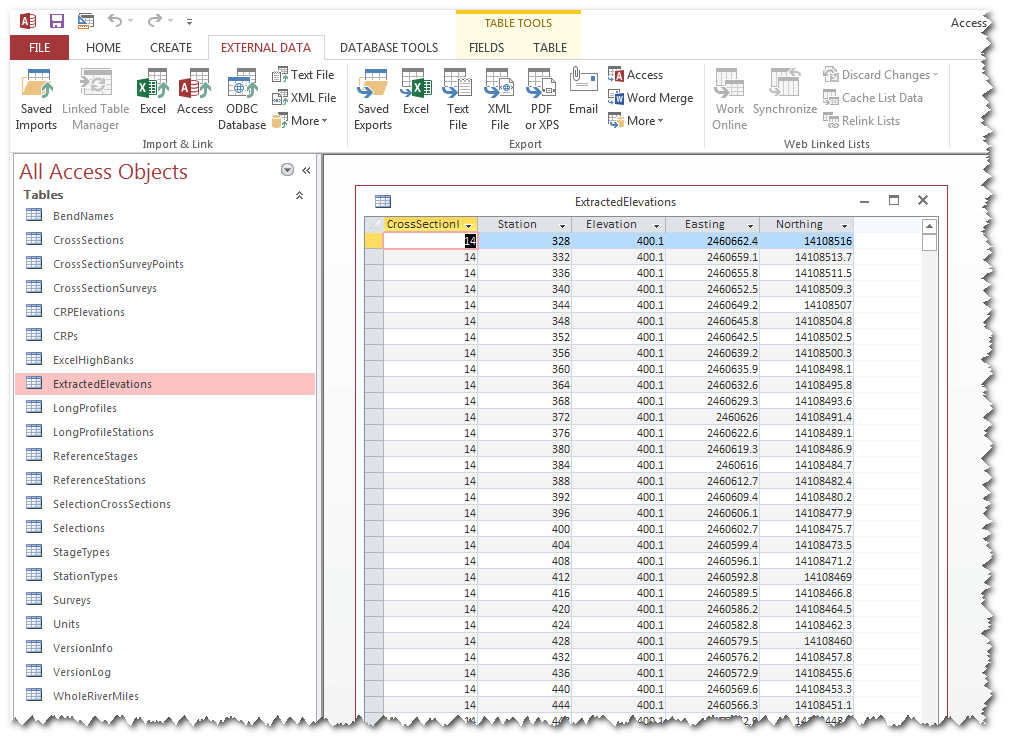
- Next create a new Survey record. This can be done manually in Access by adding a row to the
Surveystable. Or using the Cross Section Viewer software Create Survey tool. Regardless you need to open theSurveysdatabase table and determine the value of theSurveyIDfield for the survey into which you want to import the LiDAR elevations. - Create a new Microsoft Access SQL query. Switch to
SQLview and copy and paste the following SQL query text into the Window:
PARAMETERS [@SurveyID] Short;
INSERT INTO CrossSectionSurveys ( CrossSectionID, SurveyID )
SELECT ExtractedElevations.CrossSectionID, [@SurveyID] AS Expr1
FROM ExtractedElevations
GROUP BY ExtractedElevations.CrossSectionID, [@SurveyID];
- Run the query and when prompted enter the
SurveyIDinteger value identified in the previous step. The confirmation message should state the number of cross sections contained in theExtractedElevationstable. - Create a second, new Microsoft Access SQL query. Switch to
SQLview and copy and paste the following SQL query text into the Window:
PARAMETERS [@SurveyID] Short;
INSERT INTO CrossSectionSurveyPoints ( Station, Elevation, Easting, Northing )
SELECT ExtractedElevations.Station, ExtractedElevations.Elevation, ExtractedElevations.Easting, ExtractedElevations.Northing
FROM ExtractedElevations INNER JOIN CrossSectionSurveys ON ExtractedElevations.CrossSectionID = CrossSectionSurveys.CrossSectionID
WHERE (((CrossSectionSurveys.SurveyID)=[@SurveyID]));
- Run the query and again, enter the
SurveyIDinteger from before. The confirmation message should state the total number of elevation points across all cross sections. Ensure that this value is the same as the total number of records in theExtractedElevationstable. - Open the Cross Section Viewer software and use the Plot Cross Sections feature to review the final elevations. Take extra care to ensure that the left and right banks are oriented correctly in the new LiDAR cross sections, repeating the entire process if they are backward.
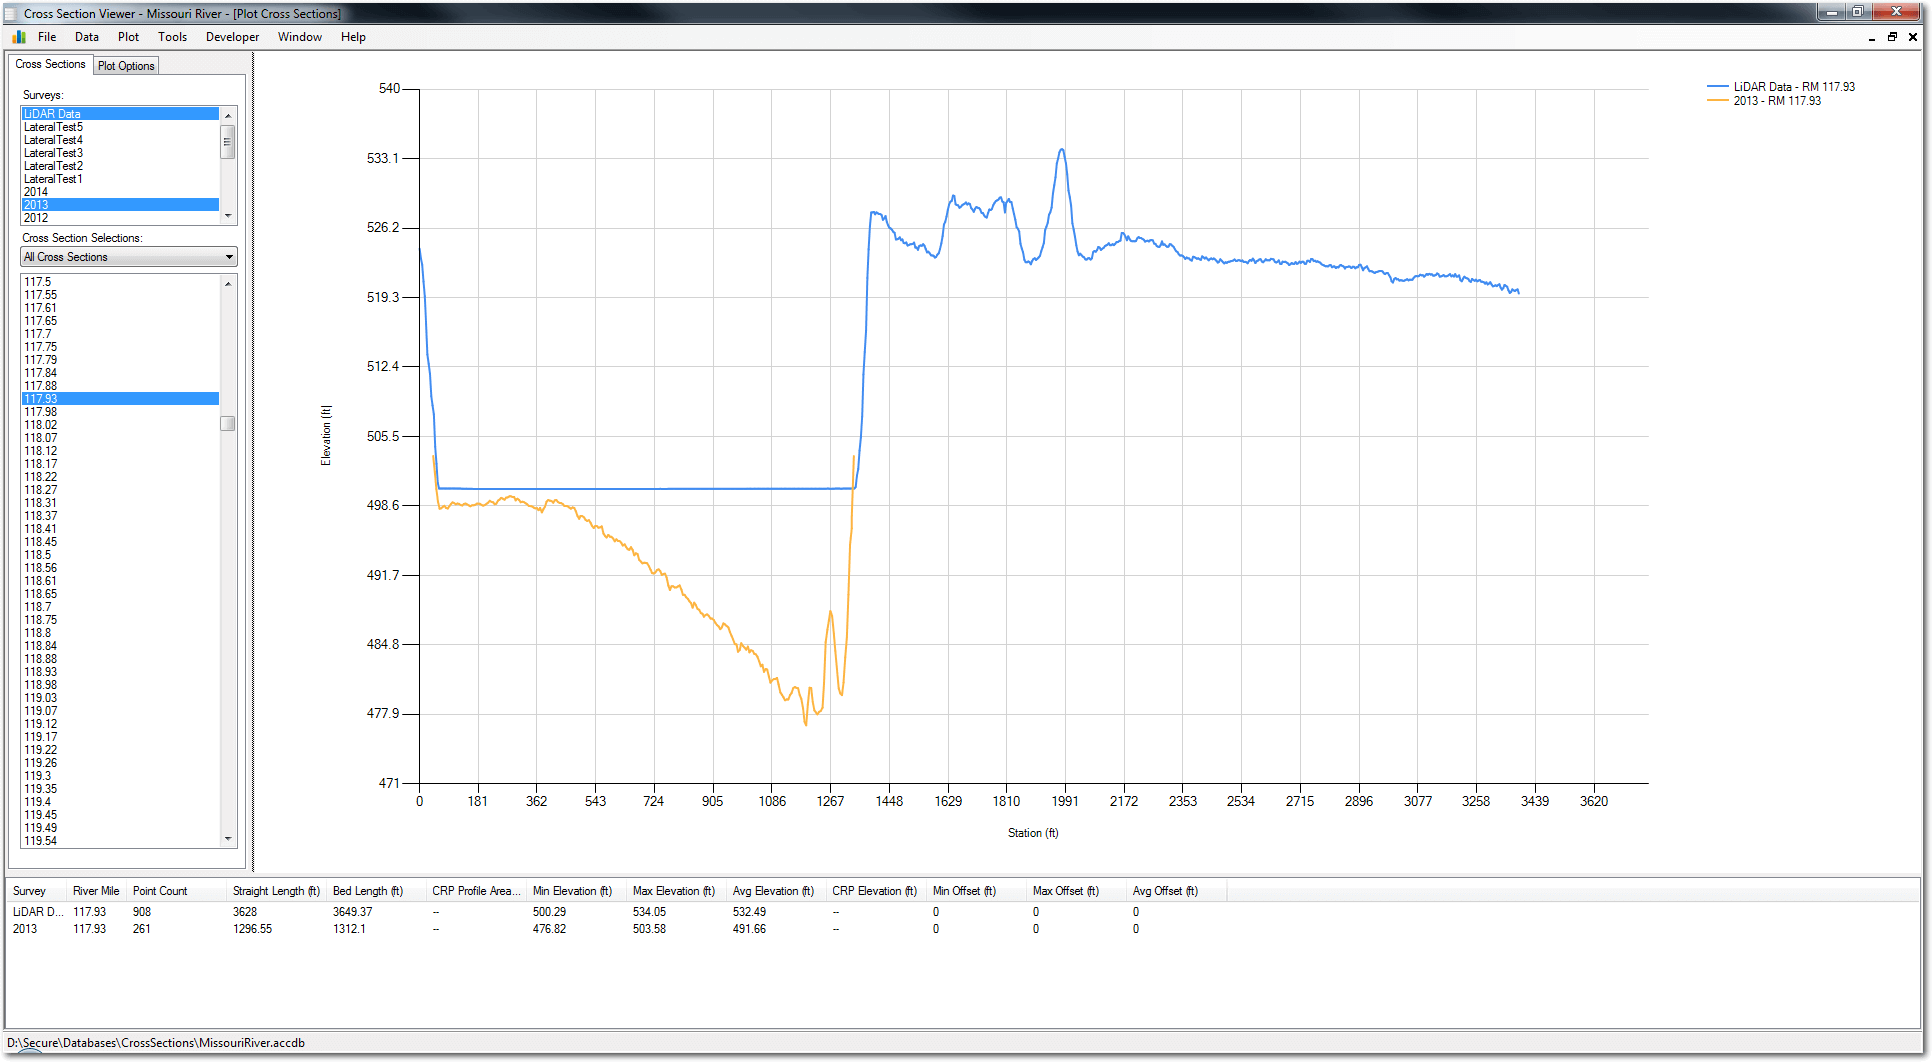
Notice how the LiDAR cross section data possess a flat surface in the wet part of the river channel. This is because the near infrared wavelength of conventional LiDAR is absorbed by water, producing no response for wet areas of the landscape. Also note that the LiDAR cross section data extend by the specified distance beyond the existing, bathymetric surveys that were constrained to the channel (except where the extended transect passed off the edge of the LiDAR DEM data extent).
Results
In March of 2016, the Elevation Extractor tool was run on LiDAR data for the Missouri River and the results imported into the USACE Cross Section Viewer database.
The extraction was performed on 1m LiDAR DEM with a 2000ft extension and sampling distance of 4ft. The process was performed in three batches that corresponded to the way the data were provided by USACE:
- 3_Platte_to_Kansas
- 4_Kansas_to_Osage
- 5_Osage_to_Mouth
Each of these batch runs included several DEM rasters. The results of each batch were output to a CSV file and these three files combined into a single copy of the Cross Section Viewer Missouri River database, provided to USACE.
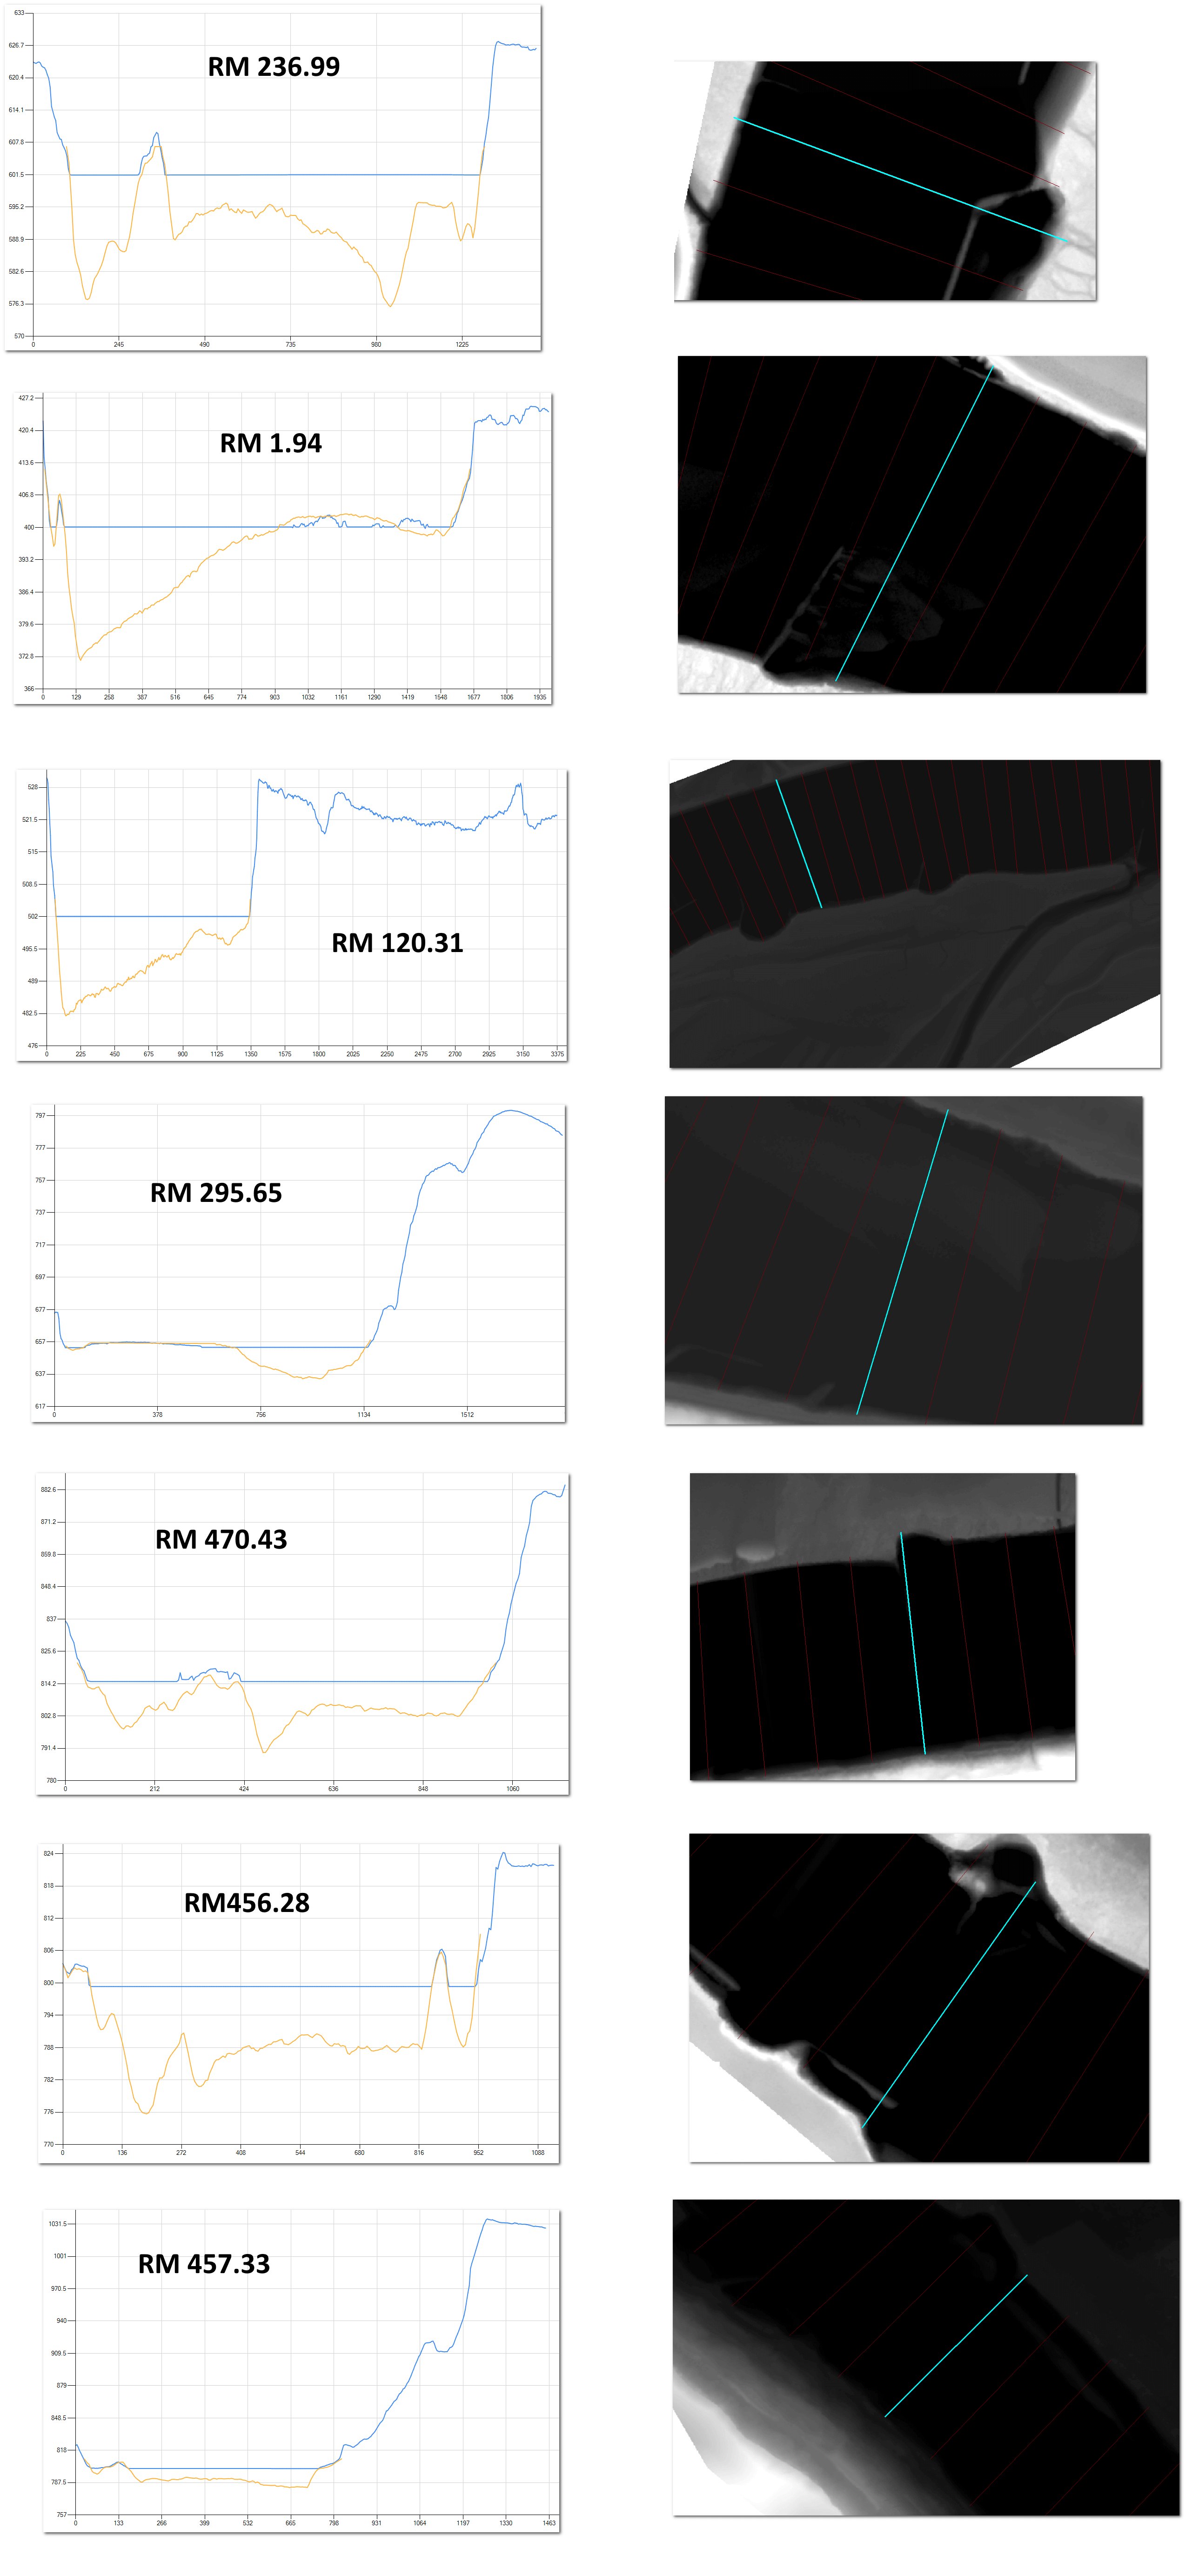
A sample of the extracted elevation are shown below. The plot shows:
- A single bathymetric survey (yellow) that only extends to the wetted extent of the channel.
- The LiDAR data that extends 2000ft onto the floodplain, or until the edge of the LiDAR DEM data extent.
The images on the right show the LiDAR DEM with the original transect in blue. In several cases you can observe shallow sections or hard structures that are clearly identifiable in the extracted LiDAR elevations.
Technology
The Elevation Extraction tool was written in C# using Visual Studio 2010 Professional. The software uses ArcObjects 10.1 Service Pack 1. The binaries and source code are available from North Arrow Research upon request.