Scenario: You want to compare the prevalence of shallow water habitat (areas with depth less than 5ft) in two, 20 mile reaches of the river. Reach 1 is 390 to 370. Reach 2 is 310 to 290.
Refer to the depth distribution tool online help for more information.
Task 1 - Open the Cross-section viewer software.
Click the Windows key on your keyboard and then start typing the name of the software “cross section viewer”. The start menu should filter your installed software to just the Cross Section Viewer software. Click the icon or name to launch the Cross Section Viewer.
Task 2 - Open the Missouri River Sample database.
Click on File -> Open Database and then browse to the location where you have saved the Missouri River database. Once you click OK the path to the database should appear in the bottom left status bar of the main Cross Section Viewer software window.
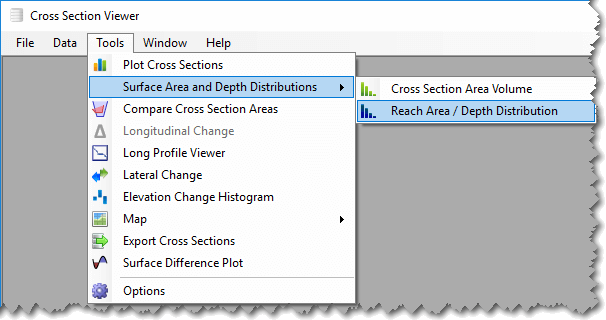
Task 3 - Select Tools -> Surface Area and Depth Distributions-> Reach Area / Depth Distribution
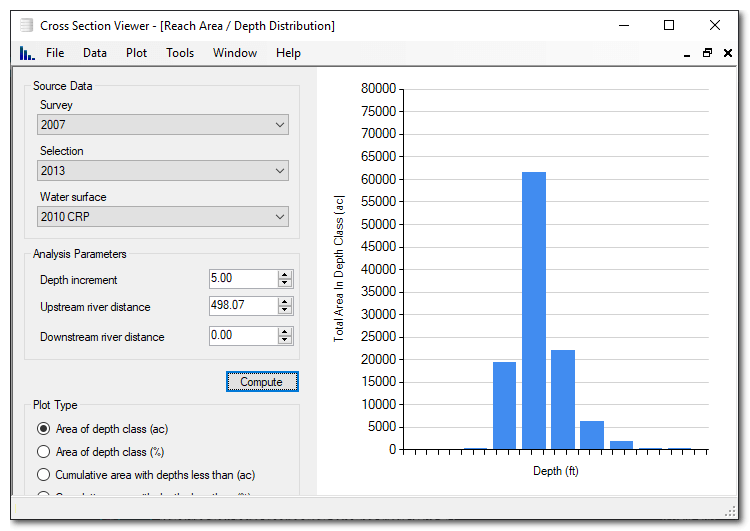
Task 4 - Compute the Depth Distribution
4.1 For Survey, select 2013
4.2 For Selection, choose an appropriate selection that will include all cross-sections in the 2013 survey.
All cross sections will work, or a 2013 selection will work.
4.3 For Water surface, select the 2010 CRP.
This is where you could select a different water surface if desired, i.e. a 2-year flow, a Bankfull “water surface”, navigation flow, etc.
4.4 Under analysis parameters: Depth increment = 5, Upstream river mile = 500, downstream river mile = 0.
The first time you run it, the river miles will revert to something else.
4.5 Click “Compute”
Task 5 - Change the River Miles to the reaches of interest and click compute again.
Reach 1 (390 to 370): What is the approximate area (ac) with depth less than 5 ft?
Reach 2 (310 to 290): What is the approximate area (ac) with depth less than 5 ft?
Task 6 - Is the difference between these two reaches a consistent difference or tied to the specific survey?
Re-do the analysis with the 2014 survey to find out.
Reach 1 (390 to 370): Approximate area (ac) with depth less than 5 ft?
Reach 2 (310 to 290): Approximate area (ac) with depth less than 5 ft?
What is the danger of using this tool on these data sets to compare shallow water habitat levels from year 2013 to 2014?
(Hint: Browse both surveys in the Plot Cross Section tool)