Long profiles can be displayed and exported from the long profile viewer. This tool displays datasets produced by the long profile generator. You need to have already generated one or more long profiles before you can use the viewer.
Features
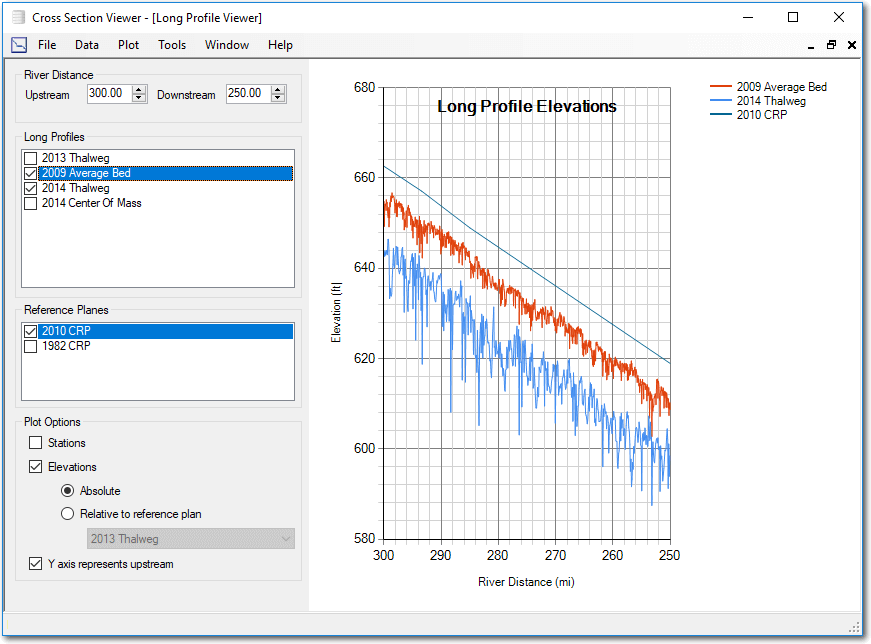
- Check the box beside one or more long profiles to include them in the plot(s). Use the long profile generator tool to produce additional datasets.
- Check the box beside one or more reference planes to include them in the plot(s). Use the Construction Reference Plane tool to generate additional reference planes.
- Enter the upstream and downstream river mile that you want to display.
- Select either the Stations and/or Elevations plot types to display. Elevations can either be displayed as absolute values above sea level, or as an offset from a selected reference plane.
- Choose whether you want the y axis (left side) of the plot to represent upstream. This is merely a convenience feature for those used to visualizing their data with river distances increasing to the left or right.
Exporting Data
Choose Export Plot Data under the Plot menu to produce a CSV file of the data currently being displayed in the plots. Note that the upstream and downstream extent of data that is written to the file is controlled by the river distance controls on the form. i.e. the export will only contain data for river distances between the displayed upstream and downstream values. However, zooming the plot (see video) does not affect the data export. If the upstream and downstream controls are set to river distances 300 to 400, but you have zoomed to 350 to 375, the export will still contain data for distances 300 to 400.
You can also export a graphic of the currently displayed plot by clicking on Export Image from the Plot menu.