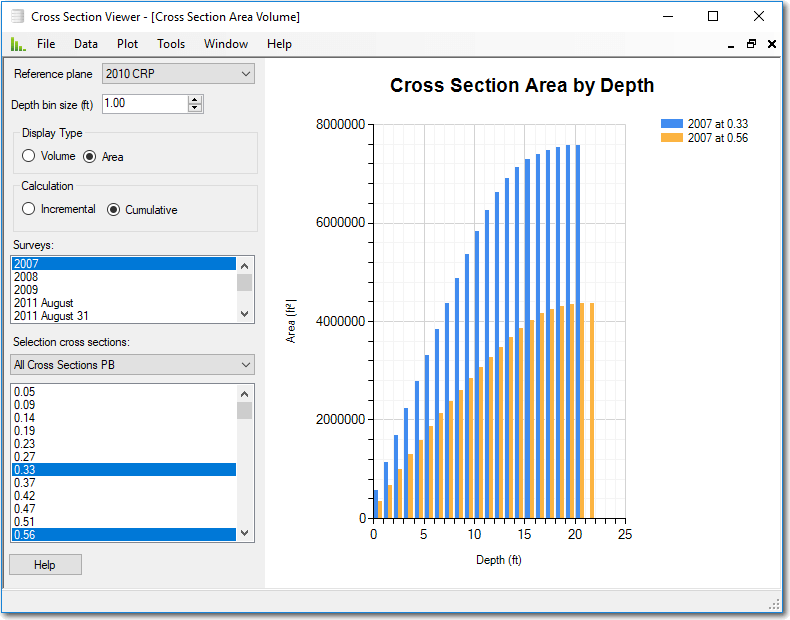
This tool computes the distribution of depths and cumulative planimetric area with depths no deeper than a given depth increment. This tool operates on a reach of cross sections, whereas the related Reach Area and Depth Tool tool performs a similar calculation but for a single cross section.
This tool operates on a single survey and selection. The upstream and downstream extents of the analysis are constrained to the most upstream and downstream cross sections that are part of the selected survey and selection. If the user specifies an upstream and/or downstream river mile for the analysis that does not occur on a surveyed cross section, then the analysis interpolates the area for each depth bin based on the nearest two cross sections.
Inputs
- Survey - A single survey that possesses the cross sections used in the analysis.
- Selection - The selection that identifies a subset of the cross sections that will be selected for the analysis.
- Water surface - the reference plane or long profile that represents the vertical upper limit of the analysis. This is depth zero at each cross section.
- Depth increment - the vertical bin size used for the analysis. The units are the same as the survey data in the Cross Section Viewer database.
- Upstream river mile - the most upstream point considered in the analysis (see comment above).
- Downstream river mile - the most downstream point considered in the analysis (see comment above).
- Plot Type - one of the following plot types:
- Area Depth class (ac) - Absolute total bed area within each depth bin class. Values are in acre feet.
- Area of depth class (%) - Relative bed area within each depth bin as a fraction of the total area of the channel. Values are in percent.
- Cumulative area with depths less than (ac) - Absolute cumulative area from depth zero down to the depth of each bin”. Values are in acre feet.
- Cumulative area within depths less than (%) - Relative cumulative area from depth zero down to the depth of each bin, as a fraction of the total area of the channel. Values are in percent.
- Cumulative area with depths greater than (ac) - Absolute cumulative area of the channel that is deeper than the depth bin. Values are in acre feet.
- Cumulative area with depths greater than (%) - Relative cumulative area of the channel that is deeper than the depth of the bin, as a fraction of the total area of the channel. Values are in percent.
The Compute button should be clicked to run the analysis each time that any of the inputs are changed. The exception is the Plot Type input. This can be changed on-the-fly without having to click the Compute button.
Export
Once the plot has been created, the underlying data, or the plot image itself, can be exported from the Plot menu. Plot data are exported to plain text, comma separated value (CSV) file, while plot images are exported to portable network graphic (PNG) files.