An engineer calls you up and asks for “bathymetry from river mile 358 to 361.” Your task is to see what data is available and to view and export the data for that reach of the river.
Task 1 - Open the Cross Section Viewer Software
Click the Windows key on your keyboard and then start typing the name of the software “cross section viewer”. The start menu should filter your installed software to just the Cross Section Viewer software. Click the icon or name to launch the Cross Section Viewer.
Task 2 - Open the Missouri River sample database
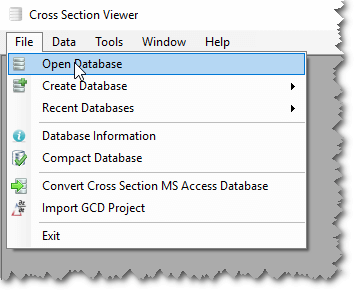
Click on File -> Open Database and then browse to the location where you have saved the Missouri River database. Once you click OK the path to the database should appear in the bottom left status bar of the main Cross Section Viewer software window.
Task 3 - Investigate the available survey years in the database
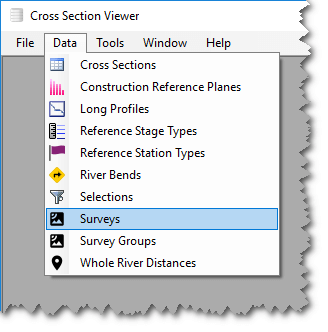
Click on the Data menu and then Surveys to see a list of all the surveys contained within the current database.
How many different surveys are in the database?
Task 4 - Investigate which years contain a specific cross-section
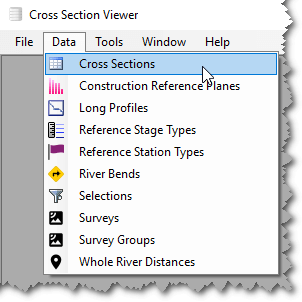
Click on the Data menu again and this time choose Cross Sections. This will display a list of each cross section defined in the current database together with summary information about the river distances and how many times it has been surveyed.
How many different surveys include a cross-sectional measurement at river mile 358.94?
Task 5 - View cross sections at river mile 358.94
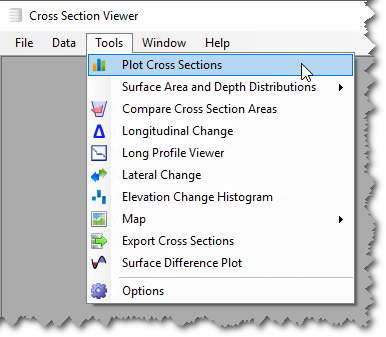
5.1 Select Tools -> Plot Cross Sections
5.2 Click on the top-most survey, then shift-click on the bottom-most survey to select all the surveys
Scroll down the list of cross sections and select 358.94
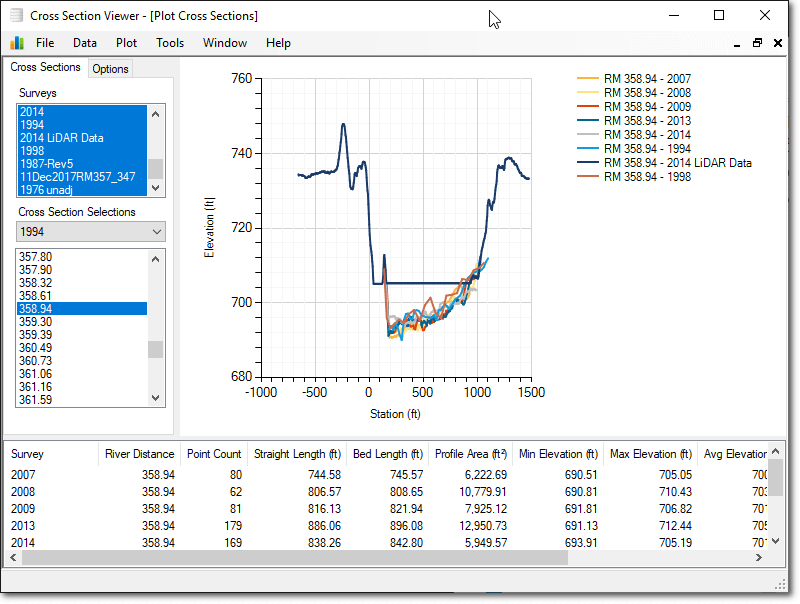
Cross section 358.94 is displayed for each year it was surveyed. The display is too crowded. Deselect all years except for 2008 and 2014. The easiest way is to click on the year 2008 then control-click on 2014.
What happened at this cross-section between 2008 and 2014?
Did nearby cross-sections behave similarly?
Click on adjacent cross sections. Notice that the 2014 survey did not include every cross section.
What happened at 359.02?
What happened at 358.85?
Close the Plot Cross Sections tool.
Task 6 Build a selection set of only 1994 cross sections
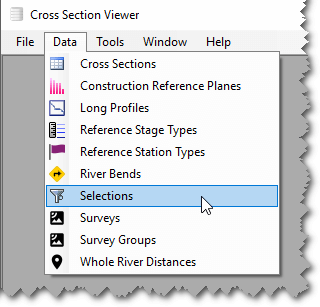
6.1 Select Data -> Selections
6.2 Create a new selection by choosing Edit -> New
6.3 Call the selection “1994” then choose the “Plus” button
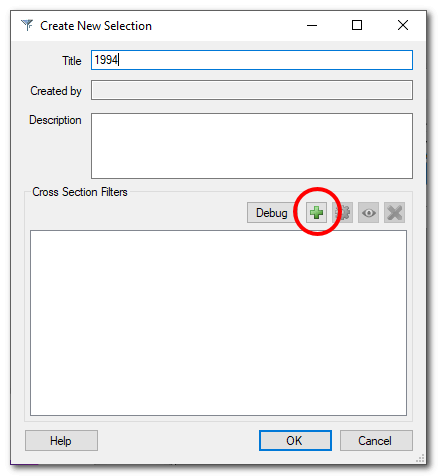
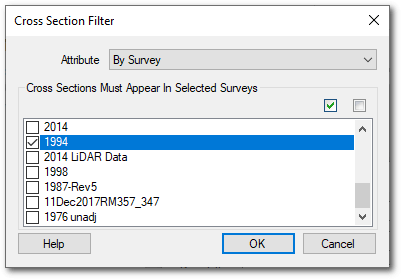
6.4 Select “By Survey” in the “Attribute” drop down. Select 1994. Push OK. Close the Selections window.
6.5 Go back to Tools -> Plot Cross Sections
6.6 Under the Cross Section Selections drop-down, select the 1994 selection.
The list of cross sections will only contain cross sections that were surveyed in 1994.
6.7 Select years 1994 and 2013.
Scroll through the list and find a cross-section that:
Degrades significantly from 1994 to 2013? (list river mile)
Aggrades significantly from 1994 to 2013?
Remains fairly stable from 1994 to 2013?
Close the Plot Cross Sections window.
TASK 7 Create a new selection that includes river miles 358 to 361.
7.1 Select Data -> Selections
7.2 Select Edit -> New
7.3 Name the selection and click the “plus” sign.
7.4 Under Attribute, select “River Mile”. Leave filter set to “Between.”
7.5 Choose a downstream river mile of 358 and an upstream of 361. Leave all other options as is and click OK twice.
How many cross-sections are in this selection?
Close the Selections window.
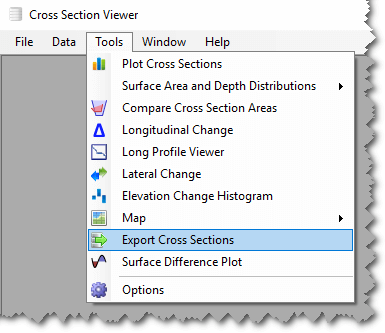
7.6 Select Tools -> Export Cross Sections
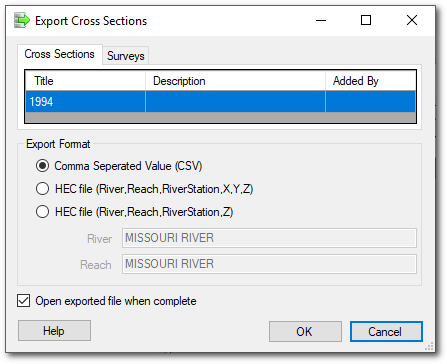
7.7 Choose the selection you just created. Leave the Export Format as “CSV.”
7.8 Click on the Surveys tab. Click on the top-most survey and shift-click the bottom most survey to select all the surveys.
7.9 Click OK.
Each survey will be saved in a separate CSV file. The survey being exported is indicated at the top of the window.
In the interest of time, save only the 1994 survey. Uncheck the box next to the other surveys.
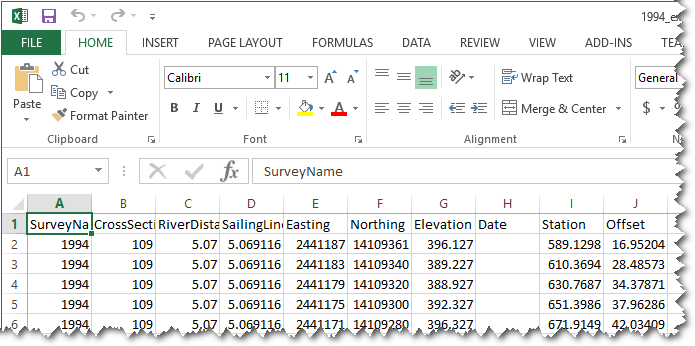
7.10 Open the .csv file with Excel.
How many bathymetric data points are there? (count the number of rows minus the header)