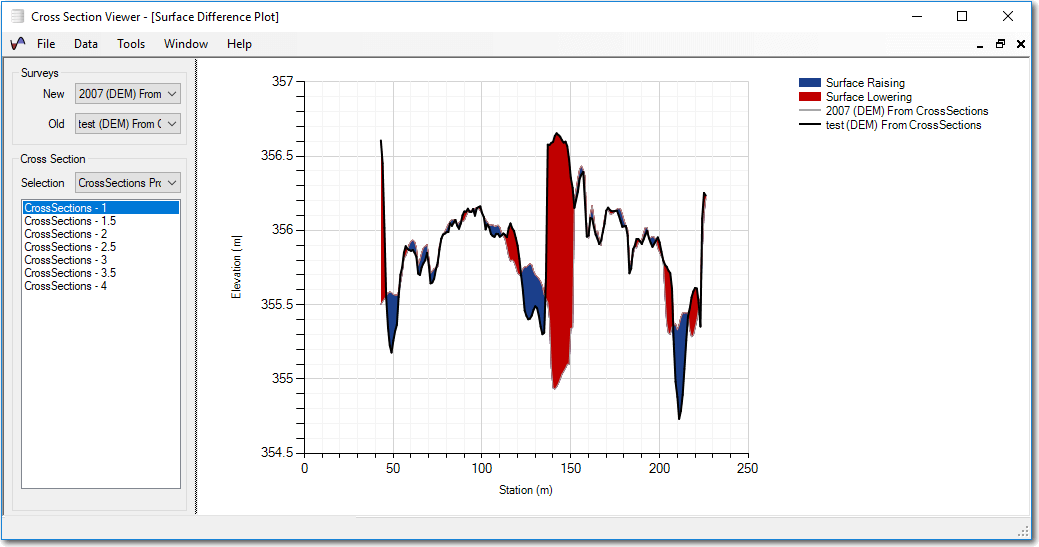
The surface difference plot helps visualize the changes in an individual cross section between two points in time. Parts of the cross section where the elevation has increased over time are shaded in blue, while places where the elevation has lowered are shaded in red.
Note! This feature currently only works for surveys that possess elevations at matching stations. This is true for GCD linear extractions but not necessarily with other survey data where the stations at which elevations are collected might differ between surveys. We intend to enhance this feature to handle such cases and also to report statistics summarizing the differences.
Inputs
- New Survey - The more recent survey that will be displayed as a light grey line.
- Old Survey - the older survey that will be displayed as a solid black line.
- Selection - the selection containing the cross sections that you want to visualize.
- Cross Section - the individual cross section within the selection that you want to visualize. Note that only one cross section can be visualized at a time.